United States · PneumococcalIncluded in shared mean
1.165 (0.970–1.395)Technical companion
Methods, data & detailed results.
Explore the estimates, methods and source files behind the paper. The supplement contains the detailed validation results and research provenance.
← Return to the evidence overviewResearch library
Examine the evidence in detail.
Compare countries and vaccines, inspect diagnostic checks or go directly to the source files.
Schedule-change event study
Schedule changes and recorded autism
Aggregate event study
The event study compares recorded autism around vaccine schedule changes with each jurisdiction’s preceding trend. The tables below report the estimates and tests of their identifying assumptions.
Across 39,753 overlapping comparisons around 404 changes in 40 countries, the uptake-scaled model estimate is 0.973 (95% random-effects interval 0.836–1.131). Adding the assumed shared-bias allowance gives 0.699–1.354. Interpreting this as an individual risk ratio depends on the uptake mixture and exposure measurements; its dose-response check fails. The estimate does not establish an unconditional upper bound on individual risk.
Schedule change
If risk rose 25%If risk rose 50%
Show the values
| Cohort | Uptake-scaled model ratio | 95% random-effects interval | Sampling only | Countries | Comparisons |
|---|---|---|---|---|---|
| −6 | 0.976 | 0.869–1.096 | 0.945–1.008 | 37 | 28,031 |
| −5 | 0.985 | 0.876–1.109 | 0.954–1.018 | 36 | 29,716 |
| −4 | 1.010 | 0.903–1.130 | 0.981–1.039 | 38 | 31,017 |
| −3 | 1.021 | 0.912–1.143 | 0.992–1.050 | 38 | 32,682 |
| −2 | 1.016 | 0.910–1.134 | 0.990–1.043 | 39 | 33,445 |
| −1 | 0.994 | 0.887–1.114 | 0.967–1.021 | 36 | 34,716 |
| 0 | 0.965 | 0.854–1.090 | 0.933–0.998 | 35 | 31,724 |
| +1 | 0.967 | 0.863–1.082 | 0.941–0.993 | 38 | 32,516 |
| +2 | 0.994 | 0.891–1.108 | 0.972–1.016 | 39 | 32,329 |
| +3 | 0.977 | 0.874–1.091 | 0.952–1.002 | 38 | 32,307 |
| +4 | 0.981 | 0.879–1.095 | 0.960–1.003 | 37 | 33,662 |
| +5 | 0.989 | 0.885–1.106 | 0.965–1.013 | 36 | 32,819 |
| +6 | 0.972 | 0.870–1.087 | 0.951–0.994 | 37 | 31,979 |
Analysis specifications and provenance: Supplement EA2
Checks the method has to pass
These are the recorded analysis-selection and diagnostic rules. Some rules were fixed before the corresponding fit, after earlier results had been inspected. Meeting a threshold is not preregistration or causal validation.
| Check and rule | Result | Status |
|---|---|---|
| Planted ×1.25 effectRecovered within 10% on the log scale | ×1.23 recovered (-8.3% error) | Pass |
| Planted ×1.5 effectRecovered within 10% on the log scale | ×1.46 recovered (-6.7% error) | Pass |
| Placebo datesThe pooled fake-date step covers 0 at 95% in at least 5 of 6 offsets | 6 of 6 offsets covered; largest |z| 1.20 | Pass |
| Additional cohort-slope (ramp) checkThe ramp test recovers a planted ramp | Slope -1.73% per cohort (calibrated -8.05 to +5.02); planted ramp recovered (+0.5% error)A slow climb to +25% by the sixth cohort is not excluded. | Pass |
| Outcomes vaccines cannot causeCheck, not a threshold: the same pipeline on control outcomes | Controls 1.011 (0.908–1.127); autism relative to controls 0.962 (0.813–1.138) | Check |
| Matched difference: autism minus controlsReported, not a gate: a matched difference on overlapping data; both intervals include 1 | 0.913 (random-effects 0.759–1.098; calibrated 0.796–1.046); planted errors -8.3% and -6.8%; placebo 6/6Not a confirmation: it shares Brazil with the headline, overlaps its data and validates the outcome side only. Anything that moves autism and its controls together, such as a coding change, cancels out in the difference. | Reported |
| Country-level placebo coverageReported, not a gate | Country sampling intervals cover 80% of 187 placebo zerosBelow 95%: the placebo-calibrated interval is shown as a secondary sensitivity for this reason. | Caution |
| School-entry exemption laws as controlsPlanted effect recovered | Planted effects recovered 35% and 28% shortOne state had usable data; the check proves nothing either way and is not used. | Did not pass |
The checks used to select this headline met their recorded thresholds. Finite fake-date and recovery checks do not certify real-event timing, individual-risk conversion or general interval coverage; the diagnostic failures remain reported below.
The matched difference between autism and its control outcomes, fitted in the same places and cohorts, is 0.91: the random-effects interval (0.76–1.10) and the calibrated interval (0.80–1.05) both include 1. It overlaps the headline's data, shares Brazil with it, checks the outcome side only, and is not a confirmation. For comparison, the control-only sensitivity gives 1.00 and the unmatched ratio 0.96.
Checks on the per-child scaling
The per-child relative risk converts a change in a cohort's autism rate into a risk per vaccinated child, using the uptake mixture 1 + p(r − 1): the cohort's rate should rise in proportion to how much its vaccination rose. Seven checks, used in this analysis, test that conversion. 6 of 7 pass.
| Check and rule | Result | Verdict |
|---|---|---|
| Measured and modeled uptake pathsAllowance intervals overlap the headline | Measured 0.934 (0.717–1.217), 14 countries; modeled 0.967 (0.807–1.159), 37 countries | Pass |
| Dropping stacks that rest on modeled pre-programme zerosAllowance intervals overlap the headline | Dropping stacks whose pre-programme cohorts rest on modeled zeros 0.894 (0.706–1.132); dropping stacks with no measured pre-programme cohort 0.851 (0.566–1.281) | Pass |
| Only countries whose uptake varies within the countryAllowance interval overlaps the headline | 0.993 (0.818–1.205), 18 countries | Pass |
| Large uptake jumps only (0.30 or more)Allowance interval overlaps the headline | 0.984 (0.843–1.148), 20,514 stacks | Pass |
| Dose-response: are raw steps proportional to the uptake jump?The intercept interval includes zero | Intercept +0.180 (95% CI +0.096 to +0.264); the slope implies r = 0.80 | Fails |
| Thirds by the size of the uptake jump agreeHeterogeneity test p above 0.05 | Lowest third 0.895, middle 0.910, highest 0.982; Q = 0.40, p = 0.82 | Pass |
| Leaving out each of the five highest-weight countriesNo leave-out moves the estimate outside the headline allowance interval | 0.970 to 0.977 (Brazil, United States, United Kingdom, Peru, South Korea) | Pass |
The estimate stays in line with the headline with only measured uptake (0.93) or only modeled uptake (0.97), with only large uptake jumps (0.98), and when stacks are split into thirds by the size of the uptake jump (the thirds agree: p = 0.82). It also stays in line when stacks that rest on modeled pre-programme zeros are dropped, when only countries whose uptake varies within the country are kept, and when each of the five highest-weight countries is left out in turn (0.970–0.977).
One check fails: the dose-response check. If the mixture formula held, raw steps would grow in proportion to the size of the uptake jump and be zero when the jump is zero. The fitted line has a positive intercept (+0.180, 95% CI +0.096 to +0.264) and a slope that implies r = 0.80. So raw steps are not proportional to the size of the uptake jump, and the per-child scaling rests partly on that assumption.
Post hoc sensitivity: the failure depends on how dependence between stacks is modeled. With events as a second random effect the implied r is 0.96 and the intercept is +0.099 (+0.023 to +0.174); with country-specific slopes the intercept's interval includes zero (-0.015 to +0.206).
Headline
All stacks (the headline)
0.973 (0.84–1.13)allowance 0.70–1.35
Uptake-path quality
Measured uptake pathsP1
0.934 (0.72–1.22)allowance 0.63–1.39
Modeled uptake pathsP1
0.967 (0.81–1.16)allowance 0.68–1.37
Modeled-zero pre cohorts outP2a
0.894 (0.71–1.13)allowance 0.61–1.30
No measured pre cohort outP2b
0.851 (0.57–1.28)allowance 0.51–1.41
Subnational-variation countriesP3
0.993 (0.82–1.20)allowance 0.70–1.41
Uptake jump ≥ 0.30P4
0.984 (0.84–1.15)allowance 0.71–1.37
Dose-response
Lowest jump tertileM2
0.895 (0.63–1.28)allowance 0.56–1.42
Middle jump tertileM2
0.910 (0.71–1.16)allowance 0.62–1.34
Highest jump tertileM2
0.982 (0.84–1.15)allowance 0.70–1.37
Implied r, random interceptM1
0.797 (0.79–0.81)the check that fails
Implied r, country + event effectsM1
0.959 (0.92–0.99)implied by the dose-response slope
Implied r, random slope tooM1
0.952 (0.79–1.12)implied by the dose-response slope
Outcome system
School censusO1
0.941 (0.77–1.15)allowance 0.66–1.34
Claims or outpatientO1
1.106 (0.77–1.58)allowance 0.70–1.76
HospitalO1
0.819 (0.49–1.36)allowance 0.46–1.47
RegistryO1
0.989 (0.75–1.31)allowance 0.66–1.49
BenefitsO1
1.094 (0.70–1.71)allowance 0.64–1.87
Leave one high-weight country out
Drop BrazilO3
0.971 (0.83–1.13)allowance 0.70–1.35
Drop the United StatesO3
0.977 (0.84–1.14)allowance 0.70–1.36
Drop the United KingdomO3
0.973 (0.83–1.14)allowance 0.70–1.36
Drop PeruO3
0.970 (0.83–1.13)allowance 0.70–1.35
Drop South KoreaO3
0.977 (0.84–1.14)allowance 0.70–1.36
Country weights
Random effects spread the weight across countries. 279 comparisons from the 8 countries added since version 5a (Argentina, BEL, Bangladesh, India, Marshall Islands, Micronesia, Palau and Ukraine) carry 9.0% of the weight. The table compares each country's weight in version 5a and in this version; intervals too wide to carry information are marked as such.
| Country | Weight, 5a | Weight, v5e | Estimate, 5a | Estimate, v5e | Stacks |
|---|---|---|---|---|---|
| Brazil | 6.1% | 5.4% | 0.984 (0.913–1.060) | 0.994 (0.933–1.058) | 32,865 |
| United Kingdom | 6.1% | 5.4% | 0.968 (0.895–1.046) | 0.968 (0.895–1.046) | 622 |
| Peru | 5.7% | 5.3% | 0.972 (0.816–1.159) | 1.013 (0.909–1.128) | 21 |
| South Korea | 5.9% | 5.2% | 0.903 (0.792–1.030) | 0.901 (0.789–1.029) | 161 |
| United States | 5.8% | 5.2% | 0.896 (0.775–1.036) | 0.896 (0.776–1.035) | 4,080 |
| Australia | 5.3% | 4.7% | 1.065 (0.825–1.375) | 1.069 (0.829–1.380) | 76 |
| Denmark | 4.7% | 4.4% | 0.889 (0.625–1.264) | 0.929 (0.679–1.270) | 7 |
| Sweden | 4.9% | 4.4% | 1.050 (0.758–1.453) | 1.050 (0.758–1.453) | 109 |
| Canada | 4.8% | 4.2% | 1.172 (0.829–1.658) | 1.167 (0.821–1.659) | 132 |
| Ecuador | 4.5% | 4.0% | 0.811 (0.551–1.192) | 0.811 (0.551–1.192) | 10 |
| Czechia | 4.1% | 4.0% | 1.176 (0.743–1.863) | 1.151 (0.779–1.701) | 312 |
| Israel | 5.8% | 3.9% | 1.032 (0.881–1.209) | 1.026 (0.683–1.541) | 2 |
| BangladeshAdded since 5a | – | 3.8% | – | 0.938 (0.615–1.428) | 4 |
| Germany | 4.0% | 3.6% | 0.786 (0.493–1.254) | 0.786 (0.493–1.254) | 96 |
| Hong Kong | 3.7% | 3.6% | 0.928 (0.553–1.555) | 0.835 (0.524–1.332) | 1 |
| Mexico | 2.2% | 3.4% | 0.775 (0.329–1.828) | 0.851 (0.509–1.422) | 23 |
| Colombia | 3.0% | 3.2% | 0.932 (0.485–1.791) | 0.946 (0.546–1.640) | 20 |
| Japan | 3.4% | 3.0% | 0.657 (0.367–1.177) | 0.657 (0.367–1.177) | 596 |
| Poland | 0.6% | 2.9% | no information | 1.224 (0.666–2.251) | 108 |
| Taiwan | 3.0% | 2.7% | 1.007 (0.525–1.930) | 1.010 (0.525–1.942) | 84 |
| ArgentinaAdded since 5a | – | 2.6% | – | 1.320 (0.663–2.627) | 168 |
| Tanzania | 2.8% | 2.5% | 1.147 (0.560–2.347) | 1.147 (0.560–2.347) | 3 |
| Norway | 2.7% | 2.4% | 1.199 (0.579–2.481) | 1.199 (0.579–2.481) | 44 |
| Slovakia | 1.9% | 1.7% | 1.024 (0.387–2.710) | 1.024 (0.387–2.710) | 1 |
| Greece | 1.6% | 1.4% | 1.372 (0.461–4.085) | 1.372 (0.461–4.085) | 6 |
| IndiaAdded since 5a | – | 1.4% | – | 0.977 (0.326–2.933) | 4 |
| France | 0.4% | 1.4% | no information | 0.813 (0.269–2.458) | 8 |
| Chile | 1.5% | 1.3% | 0.827 (0.260–2.632) | 0.827 (0.260–2.632) | 24 |
| Hungary | 0.7% | 0.6% | no information | no information | 1 |
| Finland | 0.7% | 0.6% | no information | no information | 46 |
| MicronesiaAdded since 5a | – | 0.5% | – | no information | 10 |
| UkraineAdded since 5a | – | 0.3% | – | no information | 75 |
| New Zealand | 3.7% | 0.2% | 1.075 (0.635–1.819) | no information | 4 |
| Marshall IslandsAdded since 5a | – | 0.1% | – | no information | 7 |
| Estonia | 0.2% | 0.1% | no information | no information | 5 |
| PalauAdded since 5a | – | 0.1% | – | no information | 6 |
| BELAdded since 5a | – | 0.1% | – | no information | 5 |
| Netherlands | 0.1% | 0.1% | no information | no information | 1 |
| Latvia | 0.1% | 0.1% | no information | no information | 1 |
| Slovenia | 0.0% | 0.0% | no information | no information | 5 |
Brazilweight 5.4% · 32,865 stacks
0.994 (0.933–1.058)
United Kingdomweight 5.4% · 622 stacks
0.968 (0.895–1.046)
Peruweight 5.3% · 21 stacks
1.013 (0.909–1.128)
South Koreaweight 5.2% · 161 stacks
0.901 (0.789–1.029)
United Statesweight 5.2% · 4,080 stacks
0.896 (0.776–1.035)
Australiaweight 4.7% · 76 stacks
1.069 (0.829–1.380)
Denmarkweight 4.4% · 7 stacks
0.929 (0.679–1.270)
Swedenweight 4.4% · 109 stacks
1.050 (0.758–1.453)
Canadaweight 4.2% · 132 stacks
1.167 (0.821–1.659)
Ecuadorweight 4.0% · 10 stacks
0.811 (0.551–1.192)
Czechiaweight 4.0% · 312 stacks
1.151 (0.779–1.701)
Israelweight 3.9% · 2 stacks
1.026 (0.683–1.541)
Bangladeshweight 3.8% · 4 stacks · added since 5a
0.938 (0.615–1.428)
Germanyweight 3.6% · 96 stacks
0.786 (0.493–1.254)
Hong Kongweight 3.6% · 1 stacks
0.835 (0.524–1.332)
Mexicoweight 3.4% · 23 stacks
0.851 (0.509–1.422)
Colombiaweight 3.2% · 20 stacks
0.946 (0.546–1.640)
Japanweight 3.0% · 596 stacks
0.657 (0.367–1.177)
Polandweight 2.9% · 108 stacks
1.224 (0.666–2.251)
Taiwanweight 2.7% · 84 stacks
1.010 (0.525–1.942)
Argentinaweight 2.6% · 168 stacks · added since 5a
1.320 (0.663–2.627)
Tanzaniaweight 2.5% · 3 stacks
1.147 (0.560–2.347)
Norwayweight 2.4% · 44 stacks
1.199 (0.579–2.481)
Slovakiaweight 1.7% · 1 stacks
1.024 (0.387–2.710)
Greeceweight 1.4% · 6 stacks
›
1.372 (0.461–4.085)
Indiaweight 1.4% · 4 stacks · added since 5a
0.977 (0.326–2.933)
Franceweight 1.4% · 8 stacks
0.813 (0.269–2.458)
Chileweight 1.3% · 24 stacks
0.827 (0.260–2.632)
Hungaryweight 0.6% · 1 stacks
0.533 · no information
Finlandweight 0.6% · 46 stacks
0.846 · no information
Micronesiaweight 0.5% · 10 stacks · added since 5a
0.824 · no information
Ukraineweight 0.3% · 75 stacks · added since 5a
1.172 · no information
New Zealandweight 0.2% · 4 stacks
0.981 · no information
Marshall Islandsweight 0.1% · 7 stacks · added since 5a
0.196 · no information
Estoniaweight 0.1% · 5 stacks
1.940 · no information
Palauweight 0.1% · 6 stacks · added since 5a
2.386 · no information
BELweight 0.1% · 5 stacks · added since 5a
1.800 · no information
Netherlandsweight 0.1% · 1 stacks
0.868 · no information
Latviaweight 0.1% · 1 stacks
1.260 · no information
Sloveniaweight 0.0% · 5 stacks
10.528 · no information
How much data, and what we could not get
This version's design has 11,169 outcome series in 41 countries (the headline pools 40; a country enters only if its exposure path is known) and 95,462 jurisdiction-by-change stacks. The factory inventory registers 413 source parts, 325 of them with a primary role in the design.
To check whether anything obtainable was missed, every country-by-administrative-level row of a world coverage matrix that had not yet been checked at baseline (665 rows in 228 countries) was searched, by channel and edition. After the sweep 106 rows meet the strict standard for no autism data (a saved listing, the exact queries, two or more channels and two or more independent sources), 351 were searched but fall short of it, 14 concern a level the jurisdiction does not have, 73 turned up data, 108 have data behind a request, an account, a browser-only portal or a block, and 13 remain unchecked.
| Coverage matrix, 665 baseline rows | Rows |
|---|---|
| Strict no autism data found | 106 |
| Searched, below the strict standard | 351 |
| Level does not exist | 14 |
| Data found | 73 |
| Data behind a request, account, browser portal or block | 108 |
| Still unchecked | 13 |
A second, independent pass searched 3,197 cells again with different terms, agencies and channels. It confirmed the first pass's finding of nothing in 2,942 (92.0%) and reopened 210 where it found a source. In the original matrix scope, 1,990 of 2,116 cells survived (94.0%). The weakest scope was the 61 subnational enumeration cells for Mexico, Canada, Colombia and Argentina, where 18.0% survived. Sources the second pass found were built into the data or queued.
This is a test of how reliable the search was, not a completeness percentage. The coverage matrix still has unchecked rows and channels, and a source that exists but cannot be obtained is not the same as a source that does not exist.
234 sources could not be obtained without the author contacting someone or signing in: 112 need a data request, a freedom-of-information request or an application, and 122 need a manual browser download, library access, a free account or a technical unblock. The largest gaps are national or school-level records in Japan, Mexico, Turkey, Germany and Australia. Nothing has been requested, and none of these data are in the results above.
What to know before relying on this
Not preregistered
The version 5 rule (RULE 9160) was pinned by SHA-256 in an execution freeze written before the first model call (10 October 2026, 22:03 CDT). The companion hash files the rule promised were not written. The rule was written after earlier versions' results had been seen, so version 5 is a disclosed update, not a preregistered analysis.
Minimum-span rule
Series observed in fewer than four distinct calendar years inside the estimation window are kept out of the primary pool and reported as a sensitivity, because a continuous trend and period effects can absorb nearly all of a step in so short a series. The rule was prompted by diagnostics run on real counts, so it is not outcome-blind. The same fit with the short series included gives 0.975 (0.858–1.107, calibrated).
Every obtainable source
Version 5e adds every source built and fully tested after the version 5d cut-off and before 02:00 on 15 October 2026 (the rules for it were written down as amendment A7 before any version 5d result existed; this is not preregistration). It changes no rule or threshold; new outcome sources enter only the maximal-inclusion supplement.
Files
Earlier synthesis · 5 October 2026
Shared-mean estimates across settings
This earlier analysis combines 21 vaccine or schedule contrasts in 17 settings, using 16 likelihood blocks and 8,538 reporting cells. It builds in an allowance for bias shared by every setting, so its interval is wide.
Autism · typical effect across settings
0.987
95% credible interval 0.638–1.519
The typical change in recorded autism across the 21 contrasts. 1 means no change.
What the interval means
The central estimate is close to 1. The interval is wide because the model allows for a bias that could shift every setting at once, and data cannot tell such a bias apart from a real effect. On its own, this analysis cannot rule out a moderate rise or fall; it is a second check, not the main estimate.
Under this model the typical effect is below 1 with probability 52.3% and above 1 with probability 47.7%. It exceeds a 10% increase with probability 31.0%, and a 25% increase with probability 13.9%.
What happens when more international panels are included?
A broader-inclusion sensitivity covers 22 contexts and 26 contrasts. It adds Wales, Poland, South Korea, Taiwan and Chile, and replaces Germany’s smaller series with its larger regional panel. These panels failed pretrend, placebo or simulation checks, so they are used only as a sensitivity analysis.
Autism: broader-inclusion sensitivity
Primary result
Primary · 17 contexts
0.987 (0.638–1.519)
Sensitivity with failed-diagnostic panels; not the primary
22 contexts · added-panel bias SD 0.7
0.932 (0.612–1.413)
22 contexts · added-panel bias SD 1.4
0.961 (0.624–1.470)
Show the values
| Model | Contexts | Median ratio | 95% credible interval | Probability above 1.10 | Probability above 1.25 |
|---|---|---|---|---|---|
| Primary · 17 contexts | 17 | 0.987 | 0.638–1.519 | 31.0% | 13.9% |
| 22 contexts · added-panel bias SD 0.7Sensitivity; not the primary result | 22 | 0.932 | 0.612–1.413 | 21.5% | 8.2% |
| 22 contexts · added-panel bias SD 1.4Sensitivity; not the primary result | 22 | 0.961 | 0.624–1.470 | 26.4% | 11.1% |
Ratio: the typical change in recorded autism across settings; 1 means no change. Probabilities are those of each model.
The two wider-inclusion fits vary the assumed bias of the added panels. Adding the panels moves the estimate slightly lower and barely narrows the interval; the conclusion is unchanged. Germany is counted once.
All 12 broader-inclusion scenarios · Panels, source notes and diagnostic failures1 of 53 synthesis summaries shown. Choose a question to explore its estimates.
| Comparison | Estimate (95% interval) | What it measures |
|---|---|---|
| Expanded joint model + NSCH + NHISOriginal observations: autism | 0.987 (0.638–1.519)95% credible interval | Typical effect across settings |
Local autism shares among special-education students are distinct from autism rates among all enrolled children. The local analyses separate those denominators and distinguish MMR from overall schedule compliance. Published hazard, odds and rate ratios stay on their own scales. Several summaries reuse the same data, so they are not independent confirmations.
How does the prior probability of a zero mean matter?
The Bayes factor for a zero shared mean against the specified continuous alternative is 3.18. The test concerns the shared mean log effect. A zero mean can coexist with positive and negative context effects; it is not a probability that all vaccine effects are zero.
Posterior probability of a zero mean: 76.1%. Negative mean: 12.5%. Positive mean: 11.4%.
All 90 prior-mass scenariosCohort trends, coverage lags and their limits
The source tables retain 228 calendar-aligned local specifications, 69 Montreal cohort diagnostics, 16 California coverage diagnostics and two published California prevalence slopes. These describe different outcomes and exposure measures; none supplies an extra independent sample to the main synthesis. Six Montreal coefficients have no valid uncertainty interval because their post-boundary observations are fitted exactly.
- Local coverage estimates with exact-year lags
- 304 conditional power scenarios
- Montreal cohort models and covariance alternatives
- California coverage, trend and plotting-calibration alternatives
- Published California calendar trends
Methods and source limitations are in Supplement S71. The power scenarios rely on assumed exposed-cohort shares.
Coverage and source tables
The register contains 72,585 records, many of them diagnostics and repeated specifications of the same data. Published sources contribute 4683 contrast records from 85 participant or source identifiers, some of them shared. The local audit covers 22 designs in 21 states.
Corrected Jain estimates enter one at a time as age, dose and familial-risk alternatives. Korean psychiatric outcomes include elevated subgroup estimates as well as null and inverse estimates; one impossible confidence interval printed in the source is retained and flagged, not fitted. All 13 supplementary tables are available below. Five main-versus-supplement discrepancies remain explicitly flagged and unpooled.
- Combined result register
- All synthesis summaries
- Local denominator and exposure audit
- All 49 local sensitivity fits
- All published contrasts and primary-source locators
- Korean psychiatric outcomes: all supplementary estimates
- Supplementary definitions, counts and rates
- Main and supplementary source comparisons
- 675 verification checks
Aluminum: why the comparison and measure matter
The Danish cohort’s corrected supplement includes 517 numerical estimates and 30 entries marked not estimable. Sex, birth period, follow-up age and exposure definitions vary. These are overlapping analyses of one cohort, not independent replications.
| Autism comparison | Estimate (95% CI) | Measure |
|---|---|---|
| Per additional mg, ages 2–5 | 0.93 (0.89–0.97) | Hazard ratio |
| Middle versus high aluminum | 0.97 (0.90–1.05) | Hazard ratio |
| High minus middle aluminum | +8.68 (4.98–12.38) | Cases per 10,000 by age five |
Middle means more than 1.5 up to 3 mg; high means more than 3 up to 4.5 mg by age two. Per milligram, more aluminium goes with slightly less autism (0.93), and the hazard-ratio interval for middle versus high exposure includes 1. The absolute comparison in the last row (the source’s middle-minus-high difference, reversed) is positive; it comes from a different model with different adjustment. The study’s authors conclude that aluminium from vaccines is not associated with autism. Supplement S72 explains the contrasts.
Neuropsychological outcomes and concurrent antibiotic use
The CDC report follows 1,047 children and measures neuropsychological outcomes, not autism. Its sensitivity tables examine ADHD medication, a mixed prenatal exposure score and ethylmercury exposure around antibiotic treatment. The downloadable tables contain 878 coefficients from these overlapping models; 40 repeated main-model coefficients were checked without being counted again.
Positive and inverse findings are both kept. One model reports a motor-tic association with concurrent exposure: OR 1.088 (calculated 95% interval 1.006–1.176) per microgram/kg. Among 878 correlated coefficients a few such results are expected by chance, and illness and antibiotic use at the same time could explain it. The prenatal exposure score mixes several sources and is not a vaccine count.
Administrative component fits and additional estimators
Country and vaccine comparisons
Estimates for each country and vaccine
These estimates use the administrative data alone: 15 settings and 5,133 reporting cells. The synthesis above also adds two U.S. surveys (NSCH and NHIS) and joint models for Brazil and Sweden.
Point-null calculation for the administrative subset
For this separate 15-context specification, the Bayes factor is 2.932. Posterior zero-mean probabilities are 42.3%, 74.6% and 92.1% for prior probabilities of 20%, 50% and 80%. The synthesis above has its own calculation.
Subset definitions and prior comparison · Subset continuous probabilities · Subset point-null calculations
Each row is one setting’s estimate for one vaccine, with a 95% credible interval; 1 means no change. A bias specific to one setting cannot be separated from its estimate. The U.S. rotavirus estimate is fitted jointly but left out of the shared mean.
United States · RotaShieldIncluded in shared mean
0.859 (0.334–1.853)Japan · MMRIncluded in shared mean
0.846 (0.260–2.290)Sweden · PneumococcalIncluded in shared mean
1.012 (0.784–1.564)Germany · PneumococcalIncluded in shared mean
1.015 (0.217–4.660)Hong Kong · PneumococcalIncluded in shared mean
0.891 (0.655–1.164)England · RotavirusIncluded in shared mean
0.944 (0.864–1.022)Scotland · RotavirusIncluded in shared mean
1.159 (0.480–2.818)Northern Ireland · RotavirusIncluded in shared mean
1.012 (0.878–1.155)Canada excluding Quebec · RotavirusIncluded in shared mean
1.022 (0.460–1.767)Quebec · RotavirusIncluded in shared mean
1.058 (0.746–1.450)Czechia · MMRIncluded in shared mean
0.999 (0.284–3.999)Brazil · Maternal TdapIncluded in shared mean
0.761 (0.508–1.141)Colombia · VaricellaIncluded in shared mean
0.778 (0.539–1.083)Tanzania · Schedule changeIncluded in shared mean
1.092 (0.585–1.619)United States · RotavirusEstimated separately
0.948 (0.754–1.190)Exposure-model ratio
Median (95% interval)Logarithmic chart scale: 0.2 to 5; dashed line = 1. Some rows share data, so they are not independent experiments.
Administrative-subset model and sensitivity results · Checked-design table · Frozen 60,844-row register (compressed CSV) · Frozen-register workbook
Scientific consensus
Vaccines do not cause autism
Major scientific reviews conclude that vaccines do not cause autism. It rests on more than two decades of studies in millions of children, not on any single study, and not on this site’s.
Few questions in vaccine safety have been studied as intensively. Cohorts that follow every child in a country, studies of siblings, meta-analyses and natural experiments have reached the same answer: the strongest studies do not support a causal link between vaccines and autism. Individual estimates vary, and the conclusion rests on the quality and consistency of the wider evidence.
Who has reviewed the evidence
December 2025
World Health Organization, Global Advisory Committee on Vaccine Safety
Reviewed 31 primary studies published from 2010 to 2025 on vaccines in general and on thimerosal-containing vaccines, and evidence on aluminium adjuvants. Found no causal link between vaccines and autism, reaffirming its conclusions of 2002, 2004 and 2012.
WHO statement2004
US National Academies (Institute of Medicine)
Concluded that the epidemiological evidence favours rejecting a causal relationship between MMR vaccine and autism, and between thimerosal-containing vaccines and autism.
Immunization Safety Review: Vaccines and Autism2011
US National Academies (Institute of Medicine)
In a review of adverse effects across eight vaccines, MMR and autism was one of only five vaccine–outcome pairs where the evidence favours rejecting a causal link.
Adverse Effects of Vaccines: Evidence and Causality2020
Cochrane review of MMR and MMRV vaccines
In two studies covering 1,194,764 children, autism was diagnosed at similar rates in vaccinated and unvaccinated children.
Cochrane Database of Systematic Reviews2025
American Academy of Pediatrics
Since 1998, more than 40 high-quality studies of over 5.6 million people in seven countries have found no link between vaccines and autism.
AAP statement, as reported by HealthDayWhat the conclusion rests on
A selection of the largest and most informative studies. Each compares children who received a vaccine, or an ingredient, with children who did not.
| Study | Who was studied | Children | Result |
|---|---|---|---|
| Madsen et al., New England Journal of Medicine, 2002 | Every child born in Denmark from 1991 to 1998, followed in national registers | 537,303 | Autism was no more common in vaccinated children: relative risk 0.92 (95% CI 0.68–1.24). |
| Taylor, Swerdfeger and Eslick, Vaccine, 2014 | Meta-analysis of five cohort and five case-control studies | 1,256,407 in the cohort studies | No association between vaccination and autism: odds ratio 0.99 (0.92–1.06), and none for MMR, thimerosal or mercury. |
| Jain et al., JAMA, 2015 | US children with an older sibling, including 1,929 whose older sibling was autistic | 95,727 | MMR vaccination was not associated with autism, including in children at higher familial risk. |
| Hviid et al., Annals of Internal Medicine, 2019 | Every child born in Denmark from 1999 to 2010 | 657,461 | Hazard ratio 0.93 (0.85–1.02). The study reported no evidence of increased risk overall or in its susceptibility analyses, including children with autistic siblings; subgroup estimates retain their own uncertainty. |
| Andersson et al., Annals of Internal Medicine, 2025 | Every child born in Denmark from 1997 to 2018: aluminium received from vaccines in the first two years | About 1.2 million | The main continuous-dose analysis did not find increased autism risk. Categorical and subgroup comparisons are not uniformly null and are reported separately in the synthesis and supplement. |
| Schechter and Grether, Archives of General Psychiatry, 2008 | Autism reported to California’s developmental services system, 1995–2007 | Statewide | Recorded autism continued rising after thimerosal removal. This descriptive series did not show a decline, but changing background identification prevents it from isolating the ingredient effect on its own. |
Where the claim came from
The idea took hold after a 1998 paper in The Lancet by Andrew Wakefield and colleagues that described 12 children. In January 2010 the UK General Medical Council found that the research had been carried out dishonestly and irresponsibly. The Lancet retracted the paper in full on 2 February 2010, and Wakefield was struck off the UK medical register that May. Retraction notice · BMJ report
The CDC’s 2025 page change
In November 2025 the US Centers for Disease Control and Prevention changed its vaccine-safety page to say that the statement “vaccines do not cause autism” is not evidence-based. The change cited no new research. The WHO’s expert committee reaffirmed the conclusion the next month, and the American Academy of Pediatrics, the American Medical Association and about 40 other medical organisations said the evidence is clear. Joint statement
How this site’s study fits
The schedule-change study adds a population-level test, aligning autism records with 404 dated changes in 40 countries. Its uptake-scaled model estimate is 0.97 (95% random-effects interval 0.84–1.13), close to no change. Its individual-risk interpretation remains conditional on the exposure model, and allowing shared bias widens the interval. The wider-evidence conclusion above does not depend on this analysis. See the results and diagnostic checks
The study design
Look for a change in the children whose vaccination changed.
Suppose a vaccine is added to the schedule. Compare cohorts with verified low receipt against cohorts with higher receipt, observing autism at the same later age. Birth year alone does not establish exposure: catch-up vaccination can reach children born before introduction.
The same logic works in reverse after a withdrawal: at the appropriate age, an exposure-related effect should shrink as uptake falls.
- 1Check the comparison cohorts
Verify low receipt, including catch-up doses; do not infer non-exposure from birth year alone.
- 2Verify that exposure changed
A new recommendation is useful only if uptake actually rose—or fell after a withdrawal.
- 3Find the first eligible cohorts
These children should be the first to show an effect if the vaccine changes autism risk.
- 4Compare autism at the same age
Look for a jump in the right cohort, a larger jump where uptake changed more, or a decline after withdrawal.
How the comparison works · hypothetical exampleA sharp increase in vaccination creates a clear prediction
Birth cohorts →Mandate or rollout
VaccinationExposure rises sharply
AutismMeasured later, at the same age
Vaccine exposureAutism if the claim were trueExample with no vaccine effect
The design asks whether autism breaks from its prior path exactly where exposure rises. A precisely estimated absence of that departure weighs against the specified step effect when the exposure mapping and comparison are credible.
Schematic only: these lines are hypothetical, not plotted observations. Actual estimates and uncertainty are available in the Study results and Data explorer tabs.
Estimand. Incremental effect: the outcome change associated with adding vaccine B at the expected lag, relative to comparable earlier cohorts.
From populations to individual children
What the population changes mean for one child
A change across a whole population can be turned into a risk ratio for a vaccinated child, if we know how many children were actually vaccinated and what the trend would otherwise have been. These calculations do that for the U.S. pneumococcal rollout and Japan’s MMR withdrawal, using measured uptake and the proxy and catch-up assumptions set out below. The answers depend on those assumptions.
| Trend model | Direct R | Direct nominal 95% set | Signed rollout-score set |
|---|---|---|---|
| State + cohort effects | 1.446 | 0.976 – 2.088 | 0.164 – 2.190 |
| Uptake spline | 1.727 | 1.084 – 2.642 | 0.017 – 1.367 |
| State trends | 0.976 | 0.543 – 1.462 | 0.308 – 2.706 |
| State trends + spline | 1.008 | 0.485 – 1.583 | lower search edge – 1.486 |
The two methods reuse the same 353 state–cohort cells. Neither divides by a weak first stage. Pneumococcal-containing receipt is not exact PCV7 receipt; survey exposure is held fixed. Catch-up values are assumptions, not newly observed histories. Signed-score equations may have several roots, so no unique point estimate is shown.
R = 1 means no effect under the model. A search edge is not a finite confidence bound. Different trends and exposure definitions can give different answers; none is selected because it is nearer one.
Compare the PCV methods visually
aDirect exposure model
State + cohort effects
Uptake spline
State trends
State trends + spline
bOriginal rollout-score inversion
State + cohort effects
Uptake spline
State trends
State trends + spline
Show the values
| Trend model | Direct R | Direct nominal 95% set | Signed rollout-score set | Score roots |
|---|---|---|---|---|
| State + cohort effects | 1.446 | 0.976 – 2.088 | 0.164 – 2.190 | None |
| Uptake spline | 1.727 | 1.084 – 2.642 | 0.017 – 1.367 | 0.149; 0.837 |
| State trends | 0.976 | 0.543 – 1.462 | 0.308 – 2.706 | None |
| State trends + spline | 1.008 | 0.485 – 1.583 | lower search edge – 1.486 | 0.154; 0.832 |
Any dose, remapped cohorts, no reference catch-up. The two methods reuse the same 353 state–cohort cells. A search edge is not a finite confidence bound. Signed-score equations may have several roots, so no unique point estimate is shown.
Effect-scale register (CSV) · All model estimates (JSON) · Assumptions and scope
What the data exclude
How large a rise can this model rule out?
A ratio of 1.25 means a 25% increase. These tests use the 15-setting administrative model from 5 October. Under its main assumptions it rules out a common 50% increase (though not if the bias allowances are doubled). Calibrated against the comparison outcomes, it also rules out 25%. For a null-centered, increasingly precise estimate, the stated shared-bias model has an idealized upper endpoint near 1.333. This is a conditional precision calculation, not a universal limit on all possible data.
These analyses were not preregistered. Their specifications and sensitivity checks are in the supplement; the rule files record computational settings.
Suppose the modeled effect were the same in every included context. Each row shows how large that common effect could be under a different allowance for hidden bias. Values below 1 mean fewer recorded autism diagnoses.
Empirically calibrated
Calibrated against the negative controlscommon effect; 45 controls in 9 contexts (negative-control rounds 1 and 2); assumes autism shares their biases; numerics flagged
0.871 (0.741–1.020)every calibration variant excludes RR 1.25 and 1.50
One common effect in every context
Assumed bias allowances (A1)15 contexts; common-effect model
0.964 (0.637–1.455)
Placebo-calibrated context allowancesthin importance weights (flagged)
0.974 (0.713–1.330)
Placebo-calibrated allowances, upper percentile
0.956 (0.682–1.339)
Doubled bias allowances
0.977 (0.540–1.763)
Without the four strict placebo failures
0.950 (0.601–1.496)
Without U.S. PCV
0.955 (0.627–1.449)
A different estimand
Shared meanlets each vaccine and context differ
0.957 (0.599–1.517)
Colombia’s pandemic school years
Shared mean, Colombia 2020–2021 droppedsensitivity analysis; not the primary
1.045 (0.654–1.655)
Common effect, Colombia 2020–2021 droppedsensitivity analysis; not the primary
1.054 (0.697–1.591)
Shared mean, lockdown years as a nuisancesensitivity analysis; not the primary
1.036 (0.648–1.642)
Common effect, lockdown years as a nuisancesensitivity analysis; not the primary
1.044 (0.689–1.578)
What the shared-bias allowance costs
No shared bias, assumed allowancesremoves the shared bias; a decomposition, not a test
0.963 (0.705–1.310)
No shared bias, placebo-calibrated allowancesremoves the shared bias; a decomposition, not a test
0.972 (0.858–1.104)
Common-effect assessments under assumed and placebo-calibrated bias allowances
Common RR 1.05Not excludedNot excluded with the specified or the placebo-calibrated allowances.
Common RR 1.10Not excludedNot excluded with the specified or the placebo-calibrated allowances.
Common RR 1.25Not excludedNot excluded with the specified or the placebo-calibrated allowances.
Common RR 1.50ExcludedExcluded with the assumed allowances, but not robust: it fails with doubled allowances and with one context left out. Lost when Colombia’s pandemic school years are dropped.
| Summary | P(RR > 1.05) | P(RR > 1.10) | P(RR > 1.25) | P(RR > 1.50) |
|---|---|---|---|---|
| Calibrated against the negative controlsnegative-control rounds 1 and 2; numerics flagged (thin importance weights) | 0.010excluded here, not in every calibration variant | 0.0019excluded here, not in every calibration variant | 4.6 × 10⁻⁶excluded at 95% | 3.6 × 10⁻¹¹excluded at 95% |
| Assumed bias allowances (A1) | 0.34 | 0.27 | 0.11 | 0.018excluded at 95% |
| Placebo-calibrated context allowancesthin importance weights (flagged) | 0.32 | 0.22 | 0.058 | 0.0033excluded at 95% |
| Placebo-calibrated allowances, upper percentile | 0.29 | 0.21 | 0.060 | 0.0044excluded at 95% |
| Doubled bias allowances | 0.41 | 0.35 | 0.21 | 0.078 |
| Without the four strict placebo failures | 0.33 | 0.26 | 0.12 | 0.024excluded at 95% |
| Without U.S. PCV | 0.33 | 0.25 | 0.10 | 0.017excluded at 95% |
| Shared mean | 0.35 | 0.27 | 0.13 | 0.028 |
| Shared mean, Colombia 2020–2021 droppedsensitivity | 0.49 | 0.41 | 0.22 | 0.061 |
| Common effect, Colombia 2020–2021 droppedsensitivity | 0.51 | 0.42 | 0.21 | 0.047 |
| Shared mean, lockdown years as a nuisancesensitivity | 0.48 | 0.40 | 0.21 | 0.057 |
| Common effect, lockdown years as a nuisancesensitivity | 0.49 | 0.40 | 0.20 | 0.043 |
Leaving out one context at a time (15 fits), the central estimate ranges 0.944–1.010 and the upper limit 1.435–1.553 (highest: without Colombia varicella). The data favour one common effect over the heterogeneous model by a Bayes factor of 4.64, too small to establish it. Rule, verification and every row
Estimating bias from comparison outcomes
Letting the negative controls set the bias allowances
Calibrated synthesis: 0.871 (0.741–1.020)
Letting the negative controls set the bias allowances gives 0.871 (0.741–1.020); common increases of 25% or more are excluded in every tested calibration variant and without Colombia’s 2020–21 school years (0.943, 0.802–1.105, post hoc); 5% and 10% are excluded in some variants but not others. It assumes autism’s design bias resembles the controls’; calibrating on only the five-control injury preview set gives 1.064 (0.711–1.564).
The controls are 45 same-cell negative controls in 9 of 15 contexts (negative-control rounds 1 and 2); contexts without their own controls borrow the controls’ average. A bias specific to autism series, such as an awareness-driven diagnostic trend, is not calibrated away. The estimate is flagged for thin importance weights. Two numerical integration runs agree, which is not an error bound or an independent data replication.
The calibration reads the U.S. PCV controls’ lean as drift shared with autism (moving that context from 1.17 to 0.89); without any mean shift the common effect is 0.946 (0.806–1.111), so the 25% exclusion does not depend on that reading while the 5–10% exclusions do.
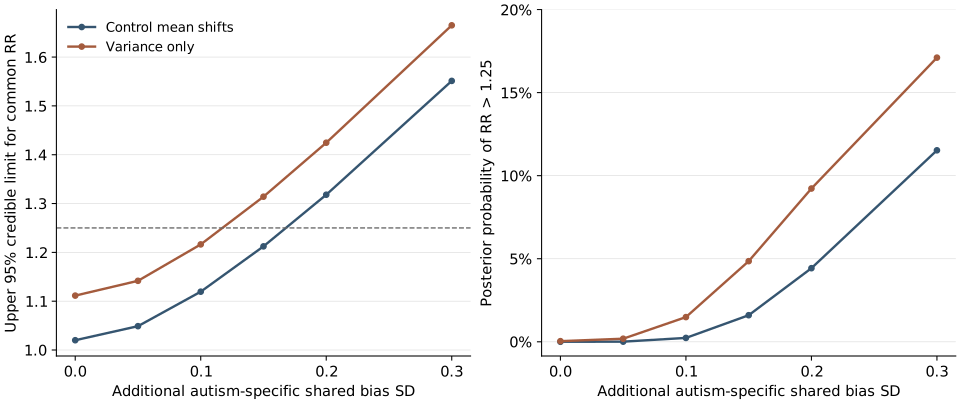
What if autism has an additional shared bias?
Controls may miss autism-specific changes in diagnosis. These post hoc scenarios allow that residual bias across all fifteen contexts. The bias size is assumed, not measured. Exclusion of a common 25% increase depends on this choice.
| Additional log-bias SD | Common RR (95% CrI) | Probability RR > 1.25 |
|---|---|---|
| 0.00 | 0.871 (0.741–1.020) | <0.1% |
| 0.05 | 0.871 (0.722–1.049) | <0.1% |
| 0.10 | 0.873 (0.680–1.119) | 0.2% |
| 0.15 | 0.876 (0.632–1.212) | 1.6% |
| 0.20 | 0.880 (0.587–1.318) | 4.4% |
| 0.30 | 0.890 (0.510–1.551) | 11.5% |
Some of the original fits rest on few effective draws, so very small tail probabilities are approximate. Correlated-control diagnostics are separate and are not refitted autism estimates.
Sensitivity chart (SVG) · Methods and checks · Data · Replay script
Pooled estimates: assumed against calibrated bias allowances
Shared mean (lets each vaccine and context differ)
Assumed allowancesprimary shared mean
0.957 (0.599–1.517)
V1 Calibrated: controls + placebo
0.877 (0.696–1.102)
V2 Variance only
0.934 (0.731–1.176)
V3 Placebo timing only
0.945 (0.759–1.157)
V4 Controls only
0.875 (0.699–1.095) †
V5 With secondary controls
0.881 (0.697–1.115) †
One common effect (the same in every context)
Assumed allowancesA1, assumed bias floors
0.964 (0.637–1.455)
V1 Calibrated: controls + placebothe reported calibrated estimate
0.871 (0.741–1.020) †
V2 Variance only
0.946 (0.806–1.111) †
V3 Placebo timing only
0.972 (0.858–1.104) †
V4 Controls only
0.868 (0.744–1.010) †
V5 With secondary controls
0.875 (0.748–1.022) †
Each context’s own data, before and after calibration
Colombia Varicella
0.764 → 0.707
Brazil Maternal DTaP
0.766 → 0.940
Japan MMR
0.849 → 0.840
U.S. RotaShield
0.872 → 0.826
Hong Kong PCV
0.892 → 0.782
England Rotavirus
0.943 → 0.923
Canada Rotavirus (excl. Quebec)
0.992 → 1.055
Northern Ireland Rotavirus
1.012 → 0.972
Sweden PCV
1.012 → 0.963
Germany PCV
1.034 → 1.033
Czechia MMR
1.035 → 1.032
Quebec Rotavirus
1.067 → 1.021
Tanzania Schedule
1.118 → 1.082
U.S. PCV
1.165 → 0.886
Scotland Rotavirus
1.551 → 1.525
Show the values
| Estimate | Estimand | Rate ratio (95% interval) |
|---|---|---|
| Assumed allowancesprimary shared mean | Shared mean | 0.957 (0.599–1.517) |
| V1 Calibrated: controls + placebo | Shared mean | 0.877 (0.696–1.102) |
| V2 Variance only | Shared mean | 0.934 (0.731–1.176) |
| V3 Placebo timing only | Shared mean | 0.945 (0.759–1.157) |
| V4 Controls only | Shared mean | 0.875 (0.699–1.095)thin importance weights |
| V5 With secondary controls | Shared mean | 0.881 (0.697–1.115)thin importance weights |
| Assumed allowancesA1, assumed bias floors | Common effect | 0.964 (0.637–1.455) |
| V1 Calibrated: controls + placebothe reported calibrated estimate | Common effect | 0.871 (0.741–1.020)thin importance weights |
| V2 Variance only | Common effect | 0.946 (0.806–1.111)thin importance weights |
| V3 Placebo timing only | Common effect | 0.972 (0.858–1.104)thin importance weights |
| V4 Controls only | Common effect | 0.868 (0.744–1.010)thin importance weights |
| V5 With secondary controls | Common effect | 0.875 (0.748–1.022)thin importance weights |
| Context | Before calibration | After calibration |
|---|---|---|
| Colombia Varicella | 0.764 (0.509–1.074) | 0.707 (0.454–1.054) |
| Brazil Maternal DTaP | 0.766 (0.513–1.145) | 0.940 (0.565–1.580) |
| Japan MMR | 0.849 (0.279–2.322) | 0.840 (0.274–2.367) |
| U.S. RotaShield | 0.872 (0.361–1.832) | 0.826 (0.339–1.849) |
| Hong Kong PCV | 0.892 (0.657–1.165) | 0.782 (0.529–1.128) |
| England Rotavirus | 0.943 (0.864–1.021) | 0.923 (0.776–1.095) |
| Canada Rotavirus (excl. Quebec) | 0.992 (0.320–1.894) | 1.055 (0.326–2.235) |
| Northern Ireland Rotavirus | 1.012 (0.878–1.155) | 0.972 (0.600–1.609) |
| Sweden PCV | 1.012 (0.786–1.555) | 0.963 (0.716–1.500) |
| Germany PCV | 1.034 (0.267–3.962) | 1.033 (0.267–3.957) |
| Czechia MMR | 1.035 (0.323–3.660) | 1.032 (0.317–3.659) |
| Quebec Rotavirus | 1.067 (0.741–1.476) | 1.021 (0.579–1.791) |
| Tanzania Schedule | 1.118 (0.543–1.687) | 1.082 (0.522–1.791) |
| U.S. PCV | 1.165 (0.970–1.393) | 0.886 (0.630–1.238) |
| Scotland Rotavirus | 1.551 (0.376–5.315) | 1.525 (0.378–5.177) |
| Variant | Estimand | Rate ratio (95% interval) | Excludes increases of | Integration runs |
|---|---|---|---|---|
| V1Calibrated: controls + placebo (reported) | heterogeneous shared mean | 0.877 (0.696–1.102) | 25%, 50% | 0.877 (0.693-1.107) / 0.877 (0.709-1.084) |
| V1Calibrated: controls + placebo (reported) | common effect | 0.871 (0.741–1.020)thin importance weights (ESS 16.4) | 5%, 10%, 25%, 50% | 0.871 (0.740-1.022) / 0.871 (0.744-1.017) |
| V2Variance only | heterogeneous shared mean | 0.934 (0.731–1.176) | 25%, 50% | 0.934 (0.726-1.181) / 0.935 (0.748-1.160) |
| V2Variance only | common effect | 0.946 (0.806–1.111)thin importance weights (ESS 10.3) | 25%, 50% | 0.947 (0.805-1.114) / 0.945 (0.807-1.105) |
| V3Placebo timing only | heterogeneous shared mean | 0.945 (0.759–1.157) | 25%, 50% | 0.946 (0.750-1.165) / 0.944 (0.779-1.136) |
| V3Placebo timing only | common effect | 0.972 (0.858–1.104)thin importance weights (ESS 43) | 25%, 50% | 0.973 (0.857-1.109) / 0.970 (0.859-1.095) |
| V4Controls only | heterogeneous shared mean | 0.875 (0.699–1.095)thin importance weights (ESS 42.9) | 10%, 25%, 50% | 0.875 (0.695-1.100) / 0.874 (0.711-1.076) |
| V4Controls only | common effect | 0.868 (0.744–1.010)thin importance weights (ESS 1.01) | 5%, 10%, 25%, 50% | 0.868 (0.743-1.012) / 0.867 (0.746-1.005) |
| V5With secondary controls | heterogeneous shared mean | 0.881 (0.697–1.115)thin importance weights (ESS 44.1) | 25%, 50% | 0.880 (0.693-1.119) / 0.886 (0.715-1.102) |
| V5With secondary controls | common effect | 0.875 (0.748–1.022)thin importance weights (ESS 26) | 5%, 10%, 25%, 50% | 0.874 (0.746-1.023) / 0.876 (0.753-1.018) |
| S1Context-mean bias only | heterogeneous shared mean | 0.877 (0.697–1.100) | 10%, 25%, 50% | 0.877 (0.693-1.105) / 0.876 (0.710-1.082) |
| S1Context-mean bias only | common effect | 0.871 (0.742–1.019)thin importance weights (ESS 3.61) | 5%, 10%, 25%, 50% | 0.872 (0.741-1.021) / 0.870 (0.745-1.013) |
| post hocColombia without its 2020-2021 school years (3371 curve) | common effect | 0.943 (0.802–1.105) | 25%, 50% | |
| post hocRound-2 categories de-nested | common effect | 0.876 (0.740–1.033) | 5%, 10%, 25%, 50% | |
| amendment 2Rounds 1 + 2 without the amendment-2 fix | common effect | 0.872 (0.741–1.023) | 5%, 10%, 25%, 50% | |
| post hocOnly the five-control injury preview set (C_INJ) | common effect | 1.064 (0.711–1.564) | none |
Probabilities of lower, near-null and higher model ratios
Joint models for several vaccines in Brazil and Sweden
Compare the findings with simulated effects
The observed result against simulated worlds
Could a common harm have produced a shared mean this low?
Each simulated world injects a common RR into every context and reruns the whole pipeline; the observed shared mean (0.957) and the Colombia sensitivity (1.045) are placed on those distributions. A common RR of 1.25 produced a shared mean as low as the observed one in 0 of 400 runs (0.25%, 1 of 400, with Colombia’s 2020–2021 school years excluded). A shared mean this low is rare under a common RR of 1.10 only with Colombia’s lockdown years included: 1.75% of runs, against 30.5% for the sensitivity estimate.
The simulations assume unbiased designs: they show sampling variability only, not protection against a bias shared by the designs.
No effect
As low as observed27.75%111 of 400
As low as sensitivity83.25%333 of 400
Common RR 1.05
As low as observed6.5%26 of 400
As low as sensitivity59%236 of 400
Common RR 1.10
As low as observed1.75%7 of 400
As low as sensitivity30.5%122 of 400
Common RR 1.25
As low as observed0%0 of 400
As low as sensitivity0.25%1 of 400
Common RR 1.50
As low as observed0%0 of 400
As low as sensitivity0%0 of 400
Show the values
| Simulated world | True common effect | Median of runs | Middle 50% of runs | 95% of runs | As low as the observed 0.957 | As low as the Colombia sensitivity 1.045 |
|---|---|---|---|---|---|---|
| No effect | 1.00 | 0.9912 | 0.9543–1.0298 | 0.8918–1.0979 | 27.75%111 of 400 runs | 83.25%333 of 400 runs |
| Common RR 1.05 | 1.05 | 1.0346 | 0.9951–1.0733 | 0.9309–1.1427 | 6.5%26 of 400 runs | 59%236 of 400 runs |
| Common RR 1.10 | 1.10 | 1.0775 | 1.0367–1.1177 | 0.9711–1.1891 | 1.75%7 of 400 runs | 30.5%122 of 400 runs |
| Common RR 1.25 | 1.25 | 1.2018 | 1.1622–1.2505 | 1.0860–1.3256 | 0%0 of 400 runs | 0.25%1 of 400 runs |
| Common RR 1.50 | 1.50 | 1.4042 | 1.3621–1.4568 | 1.2668–1.5543 | 0%0 of 400 runs | 0%0 of 400 runs |
Runs in each histogram bin
Equal-ratio histogram, no smoothing: bin k spans [0.84*1.02^k, 0.84*1.02^(k+1)), 34 bins; counts out of 400 runs per world.
| Shared mean from | to | No effect | Common RR 1.05 | Common RR 1.10 | Common RR 1.25 | Common RR 1.50 |
|---|---|---|---|---|---|---|
| 0.8400 | 0.8568 | 1 | 0 | 0 | 0 | 0 |
| 0.8568 | 0.8739 | 4 | 0 | 0 | 0 | 0 |
| 0.8739 | 0.8914 | 5 | 1 | 0 | 0 | 0 |
| 0.8914 | 0.9092 | 11 | 3 | 0 | 0 | 0 |
| 0.9092 | 0.9274 | 18 | 4 | 1 | 0 | 0 |
| 0.9274 | 0.9460 | 32 | 11 | 3 | 0 | 0 |
| 0.9460 | 0.9649 | 58 | 16 | 3 | 0 | 0 |
| 0.9649 | 0.9842 | 53 | 31 | 10 | 0 | 0 |
| 0.9842 | 1.0039 | 57 | 55 | 18 | 0 | 0 |
| 1.0039 | 1.0240 | 42 | 57 | 26 | 0 | 0 |
| 1.0240 | 1.0444 | 50 | 56 | 61 | 1 | 0 |
| 1.0444 | 1.0653 | 33 | 41 | 49 | 5 | 0 |
| 1.0653 | 1.0866 | 18 | 50 | 58 | 5 | 0 |
| 1.0866 | 1.1084 | 12 | 37 | 47 | 11 | 0 |
| 1.1084 | 1.1305 | 3 | 17 | 47 | 18 | 0 |
| 1.1305 | 1.1531 | 3 | 14 | 40 | 40 | 0 |
| 1.1531 | 1.1762 | 0 | 4 | 15 | 54 | 0 |
| 1.1762 | 1.1997 | 0 | 3 | 16 | 62 | 1 |
| 1.1997 | 1.2237 | 0 | 0 | 3 | 51 | 0 |
| 1.2237 | 1.2482 | 0 | 0 | 3 | 52 | 2 |
| 1.2482 | 1.2732 | 0 | 0 | 0 | 46 | 10 |
| 1.2732 | 1.2986 | 0 | 0 | 0 | 25 | 9 |
| 1.2986 | 1.3246 | 0 | 0 | 0 | 19 | 21 |
| 1.3246 | 1.3511 | 0 | 0 | 0 | 5 | 41 |
| 1.3511 | 1.3781 | 0 | 0 | 0 | 5 | 55 |
| 1.3781 | 1.4057 | 0 | 0 | 0 | 1 | 65 |
| 1.4057 | 1.4338 | 0 | 0 | 0 | 0 | 51 |
| 1.4338 | 1.4625 | 0 | 0 | 0 | 0 | 53 |
| 1.4625 | 1.4917 | 0 | 0 | 0 | 0 | 46 |
| 1.4917 | 1.5215 | 0 | 0 | 0 | 0 | 24 |
| 1.5215 | 1.5520 | 0 | 0 | 0 | 0 | 11 |
| 1.5520 | 1.5830 | 0 | 0 | 0 | 0 | 7 |
| 1.5830 | 1.6147 | 0 | 0 | 0 | 0 | 3 |
| 1.6147 | 1.6470 | 0 | 0 | 0 | 0 | 1 |
| Simulated world | Simulated shared means, 95% range | As low as observed | As low as the Colombia sensitivity |
|---|---|---|---|
| No effect | 0.892–1.098 | 27.75% 111 of 400 | 83.25% 333 of 400 |
| Common RR 1.05 | 0.931–1.143 | 6.50% 26 of 400 | 59.00% 236 of 400 |
| Common RR 1.10 | 0.971–1.189 | 1.75% 7 of 400 | 30.50% 122 of 400 |
| Common RR 1.25 | 1.086–1.326 | 0.00% 0 of 400 | 0.25% 1 of 400 |
| Common RR 1.50 | 1.267–1.554 | 0.00% 0 of 400 | 0.00% 0 of 400 |
Checking for misleading associations
Do the methods find changes they should not?
Each design was rerun on outcomes vaccines should not affect, mostly injuries, in the same or nearby data. If the vaccine cannot affect the chosen control outcome, an association there can signal bias. Whether autism shares that bias is a further assumption. In 9 of 16 settings the control intervals include 1; 4 show a bias signal, which the calibrated sensitivity models under its shared-bias assumptions. Asthma and broad disability categories are weaker controls than injuries.
4contexts with a bias signal9with controls consistent with 12with only imprecise controls1without a control on their own cells (Quebec Rotavirus: report-only analogue at most)452fitted control estimates (28 bias signals, 195 consistent, 229 too imprecise) in 25 analyses
Where a design found an “effect” on injuries
These designs returned a result away from 1 for a candidate control outcome. Vaccination should not affect that outcome, so the design is probably picking up bias, and its autism estimate may share it.
- U.S. PCV (Core)IDEA hearing impairment (non-injury control): 1.41 (1.05–1.91), r > 1 (harm direction); source readings: MIXED (3326), unresolved by the controls; the calibration resolves it only by assumption (U.S. PCV 1.17 to 0.89)Autism in the same design: 1.17 (0.97–1.39)
- Hong Kong PCVRoad-Traffic Casualties (Police-Reported): 0.66 (0.48–0.92), r < 1 (protective direction); source readings: BIAS SIGNAL (System reading (rule written with the deciding estimate known)) (3342); UNINFORMATIVE (3343)Autism in the same design: 0.89 (0.66–1.16)
- Brazil Maternal DTaPAll Injuries: 0.51 (0.29–0.83), r < 1 (protective direction); source readings: DESIGN BIAS DETECTED (r < 1) (3332, 3382); CONSISTENT (3347)Autism in the same design: 0.77 (0.51–1.14)
- U.S. Rotavirus 2006 (Untied)IDEA traumatic brain injury: 2.37 (1.09–4.58), r > 1 (harm direction)Autism in the same design: 0.95 (0.76–1.19)
Controls compatible with no association
The most precise control in each context without a bias signal. Consistent with 1 means no bias was detected at this precision.
- Sweden PCVAll Injuries (S00-T98 Excl. T78, T80-T88): 1.06 (0.98–1.13)same cells as the autism estimate: SWE_A (reading): SWE_PCV_corrected cells · Round 2 · analysis 3381
- Tanzania SchedulePupils with albinism (non-injury control): 1.00 (0.69–1.28)same cells as the autism estimate: Std I-VII x 7 school years (2016, 2017, 2020-2024) · Round 1 · analysis 3339
- Canada Rotavirus (Excl. Quebec)Asthma incidence (CCDSS, 1-19) (non-injury control): 0.71 (0.48–1.06)same cells as the autism estimate: CAN_noQC province x fiscal year, ages 1-19 (the block's 166 cells) · Round 2 · analysis 3384
- England RotavirusAll road casualties: 1.00 (0.87–1.16)same design, cells restricted by year: 112 of the design's 128 cells (census years 2011-2024); autism refitted on the same cells · Round 2 · analysis 3380
- Colombia VaricellaSchool census motor / physical disability (non-injury control): 0.87 (0.67–1.28)same cells, observed subset: 28 regions x 3 levels x 2019-2024, observed cells · Round 1 · analysis 3338
- Japan MMR (Core)All injuries: 0.89 (0.48–1.67)nearby or wider cells: the 9 Honda cohorts (national) · Round 1 · analysis 3347
2 more contexts with consistent controls are listed below.
Controls show a bias signal
Designs where an outcome the vaccine should not change shows an effect.
U.S. PCV (Core)
1.17 (0.97–1.39)Autism
IDEA hearing impairment
1.41 (1.05–1.91)Bias signal
IDEA traumatic brain injury
›
1.65 (0.77–4.29)Too imprecise
U.S. Rotavirus 2006 (TBI Cells)
0.75 (0.55–1.01)Autism
IDEA traumatic brain injury
›
2.37 (1.09–4.58)Bias signal
Brazil Maternal DTaP
0.77 (0.51–1.14)Autism
Injury admissions
0.51 (0.29–0.83)Bias signal
Injury deaths
‹
0.36 (0.15–0.79)Bias signal
Brazil Hepatitis A (Not Pooled)
2.17 (1.36–3.98)Autism
Injury admissions
›
2.01 (1.15–4.23)Bias signal
Hong Kong PCV
0.89 (0.66–1.16)Autism
Physical disability
1.78 (1.23–2.90)Bias signal
Road-traffic casualties
0.66 (0.48–0.92)Bias signal
Controls consistent with 1
Outcomes the vaccine should not change show no change.
England Rotavirus
0.94 (0.86–1.02)Autism
Autism, 2011–2024 cellsAutism refitted on the 112 cells the road-casualty control uses
0.97 (0.89–1.06)Autism
Road casualties, 2011–2024 cells
1.00 (0.87–1.16)Consistent with 1
Injury admissions (HES)
0.99 (0.57–1.57)Consistent with 1
Colombia Varicella
0.76 (0.51–1.07)Autism
Autism, without 2020–21Autism refitted without school years 2020–21
1.32 (0.90–1.99)Autism
Hearing disability
0.98 (0.66–1.49)Consistent with 1
Motor/physical disability
0.87 (0.67–1.28)Consistent with 1
Visual disability
0.90 (0.58–1.27)Consistent with 1
Transport injuries
1.36 (0.99–1.93)Consistent with 1 (borderline)
Tanzania Schedule
1.12 (0.54–1.69)Autism
Pupils with albinism
1.00 (0.69–1.28)Consistent with 1
Japan MMR
0.85 (0.28–2.32)Autism
Injury deaths
0.86 (0.46–1.61)Consistent with 1
Sweden PCV
1.01 (0.79–1.56)Autism
All injuries
1.06 (0.98–1.13)Consistent with 1
Controls too imprecise to judge
The control intervals are too wide to rule a bias in or out.
Germany PCV
1.03 (0.27–3.96)Autism
All injuries
1.09 (0.31–3.91)Too imprecise
Czechia MMR
1.04 (0.32–3.66)Autism
All injuries
›
1.19 (0.32–4.48)Too imprecise
Show the values
| Design | Row | Rate ratio | 95% interval | Reading |
|---|---|---|---|---|
| U.S. PCV (Core) | Autism estimate | 1.17 | 0.97–1.39 | Autism |
| U.S. PCV (Core) | IDEA hearing impairment | 1.41 | 1.05–1.91 | Bias signal |
| U.S. PCV (Core) | IDEA traumatic brain injury | 1.65 | 0.77–4.29 | Too imprecise |
| U.S. Rotavirus 2006 (TBI Cells) | Autism estimate | 0.75 | 0.55–1.01 | Autism |
| U.S. Rotavirus 2006 (TBI Cells) | IDEA traumatic brain injury | 2.37 | 1.09–4.58 | Bias signal |
| Brazil Maternal DTaP | Autism estimate | 0.77 | 0.51–1.14 | Autism |
| Brazil Maternal DTaP | Injury admissions | 0.51 | 0.29–0.83 | Bias signal |
| Brazil Maternal DTaP | Injury deaths | 0.36 | 0.15–0.79 | Bias signal |
| Brazil Hepatitis A (Not Pooled) | Autism estimate | 2.17 | 1.36–3.98 | Autism |
| Brazil Hepatitis A (Not Pooled) | Injury admissions | 2.01 | 1.15–4.23 | Bias signal |
| Hong Kong PCV | Autism estimate | 0.89 | 0.66–1.16 | Autism |
| Hong Kong PCV | Physical disability | 1.78 | 1.23–2.90 | Bias signal |
| Hong Kong PCV | Road-traffic casualties | 0.66 | 0.48–0.92 | Bias signal |
| England Rotavirus | Autism estimate | 0.94 | 0.86–1.02 | Autism |
| England Rotavirus | Autism, 2011–2024 cellsAutism refitted on the 112 cells the road-casualty control uses | 0.97 | 0.89–1.06 | Autism |
| England Rotavirus | Road casualties, 2011–2024 cells | 1.00 | 0.87–1.16 | Consistent with 1 |
| England Rotavirus | Injury admissions (HES) | 0.99 | 0.57–1.57 | Consistent with 1 |
| Colombia Varicella | Autism estimate | 0.76 | 0.51–1.07 | Autism |
| Colombia Varicella | Autism, without 2020–21Autism refitted without school years 2020–21 | 1.32 | 0.90–1.99 | Autism |
| Colombia Varicella | Hearing disability | 0.98 | 0.66–1.49 | Consistent with 1 |
| Colombia Varicella | Motor/physical disability | 0.87 | 0.67–1.28 | Consistent with 1 |
| Colombia Varicella | Visual disability | 0.90 | 0.58–1.27 | Consistent with 1 |
| Colombia Varicella | Transport injuries | 1.36 | 0.99–1.93 | Consistent with 1 (borderline) |
| Tanzania Schedule | Autism estimate | 1.12 | 0.54–1.69 | Autism |
| Tanzania Schedule | Pupils with albinism | 1.00 | 0.69–1.28 | Consistent with 1 |
| Japan MMR | Autism estimate | 0.85 | 0.28–2.32 | Autism |
| Japan MMR | Injury deaths | 0.86 | 0.46–1.61 | Consistent with 1 |
| Sweden PCV | Autism estimate | 1.01 | 0.79–1.56 | Autism |
| Sweden PCV | All injuries | 1.06 | 0.98–1.13 | Consistent with 1 |
| Germany PCV | Autism estimate | 1.03 | 0.27–3.96 | Autism |
| Germany PCV | All injuries | 1.09 | 0.31–3.91 | Too imprecise |
| Czechia MMR | Autism estimate | 1.04 | 0.32–3.66 | Autism |
| Czechia MMR | All injuries | 1.19 | 0.32–4.48 | Too imprecise |
Context by context
Reading rows only: the main comparison outcome used in each analysis, in both rounds. Classes are the negative-control summary’s uniform class (analysis 3330); each source’s own verdict is in the full table. A control is too imprecise when its interval is far wider than the autism interval it checks, or is dominated by the prior.
U.S. PCV (Core)
Pooled in the synthesis · autism, own data 1.17 (0.97–1.39)- IDEA hearing impairment (non-injury control)Round 1 · analysis 3326 · same cells, observed subset1.41 (1.05–1.91)Bias signal
- IDEA orthopedic impairment (non-injury control)Round 1 · analysis 3326 · same cells, observed subset1.43 (0.91–2.26)Too imprecise
- IDEA traumatic brain injuryRound 1 · analysis 3331 · nearby or wider cells0.84 (0.46–1.35)Too imprecise
- IDEA visual impairment (non-injury control)Round 1 · analysis 3326 · same cells, observed subset1.45 (0.74–2.72)Too imprecise
- IDEA traumatic brain injuryRound 1 · analysis 3331 · same cells, observed subset1.65 (0.77–4.29)Too imprecise
- Unintentional injury (V01-X59), ages 0-5Round 2 · analysis 3383 · nearby or wider cells2.59 (1.15–5.76)Too imprecise · interval excludes 1
Source readings: MIXED (3326), unresolved by the controls; the calibration resolves it only by assumption (U.S. PCV 1.17 to 0.89)
U.S. RotaShield (Core)
Pooled in the synthesis · autism, own data 0.87 (0.36–1.83)- IDEA traumatic brain injuryRound 1 · analysis 3331 · same cells, observed subset0.69 (0.20–2.21)Too imprecise
- Unintentional injury (V01-X59), ages 0-5Round 2 · analysis 3383 · nearby or wider cells0.82 (0.17–3.13)Too imprecise
Japan MMR (Core)
Pooled in the synthesis · autism, own data 0.85 (0.28–2.32)- All injuriesRound 1 · analysis 3347 · nearby or wider cells0.89 (0.48–1.67)Consistent with 1
- All unintentional injuriesRound 1 · analysis 3341 · nearby or wider cells0.86 (0.46–1.61)Consistent with 1
- Accidents (不慮の事故)Round 2 · analysis 3385 · nearby or wider cells1.00 (0.41–2.21)Consistent with 1
Source readings: CONSISTENT (3341, 3347); UNINFORMATIVE -> NOT TESTABLE: no conclusion about bias in this design (3385)
Sweden PCV
Pooled in the synthesis · autism, own data 1.01 (0.79–1.56)- Unintentional injuriesRound 1 · analysis 3347 · design analogue0.71 (0.32–1.62)Consistent with 1
- All Injuries (S00-T98 Excl. T78, T80-T88)Round 2 · analysis 3381 · same cells as the autism estimate1.06 (0.98–1.13)Consistent with 1
Source readings: CONSISTENT (3347, 3381)Secondary rows with a bias signal: Lumbar or Pelvic Fracture (S32) 2.02 (1.09–3.58); Shoulder or Upper-Arm Fracture (S42) 1.12 (1.02–1.21)
Germany PCV
Pooled in the synthesis · autism, own data 1.03 (0.27–3.96)Counted as consistent in the reading tally, with a caveat: too imprecise on its own cells; national deaths consistent only under a post-rule implementation note (uninformative under the literal rule).
- Unintentional injuriesRound 1 · analysis 3347 · design analogue1.01 (0.50–1.81)Consistent with 1
- All Injuries (S00-T98 Excl. T78, T80-T88)Round 2 · analysis 3381 · same cells as the autism estimate1.09 (0.31–3.91)Too imprecise
Source readings: CONSISTENT (literal rule: UNINFORMATIVE (c)) (3347); UNINFORMATIVE (3381)
Hong Kong PCV
Pooled in the synthesis · autism, own data 0.89 (0.66–1.16)- Road-Traffic Casualties (Police-Reported)Round 2 · analysis 3385 · nearby or wider cells0.66 (0.48–0.92)Bias signal
- SEN physical + visual + hearing (non-injury control)Round 1 · analysis 3342 · same cells as the autism estimate1.15 (0.90–1.47)Consistent with 1
- All injuriesRound 1 · analysis 3343 · nearby or wider cells0.89 (0.26–3.74)Too imprecise
Source readings: BIAS SIGNAL (System reading (rule written with the deciding estimate known)) (3342); UNINFORMATIVE (3343)Secondary rows with a bias signal: SEN physical + visual (non-injury control) 1.50 (1.09–2.22); SEN physical disability (non-injury control) 1.78 (1.23–2.90)
England Rotavirus
Pooled in the synthesis · autism, own data 0.94 (0.86–1.02)- All road casualtiesRound 2 · analysis 3380 · nearby or wider cells1.06 (0.94–1.19)Consistent with 1
- All road casualtiesRound 2 · analysis 3380 · same design, cells restricted by year1.00 (0.87–1.16)Consistent with 1
- Injuries, foreign bodies, burns, frostbite (S00-T35)Round 2 · analysis 3380 · nearby or wider cells0.99 (0.57–1.57)Consistent with 1
- Unintentional external causes (V01-X59 excl. X30-X39)Round 2 · analysis 3380 · nearby or wider cells0.98 (0.53–1.60)Consistent with 1
- All unintentional injuries (V01-X59 excl. X30-X39)Round 1 · analysis 3333 · nearby or wider cells0.80 (0.46–1.32)Too imprecise
- All unintentional injuries (V01-X59 excl. X30-X39)Round 1 · analysis 3333 · nearby or wider cells0.57 (0.25–1.22)Too imprecise
- Injuries, foreign bodies, burns, frostbite (S00-T35)Round 2 · analysis 3380 · nearby or wider cells0.96 (0.69–1.29)Too imprecise
- Unintentional external causes (V01-X59 excl. X30-X39)Round 2 · analysis 3380 · nearby or wider cells0.98 (0.69–1.34)Too imprecise
Secondary rows with a bias signal: Poisoning (T36-T65) 0.41 (0.19–0.85)
Scotland Rotavirus
Pooled in the synthesis · autism, own data 1.55 (0.38–5.31)- All unintentional injuries (V01-X59 excl. X30-X39)Round 1 · analysis 3333 · nearby or wider cells0.87 (0.32–2.31)Consistent with 1
- All unintentional-injury admissionsRound 2 · analysis 3380 · nearby or wider cells1.11 (0.42–2.75)Consistent with 1
- All unintentional injuries (V01-X59 excl. X30-X39)Round 1 · analysis 3333 · nearby or wider cells0.88 (0.24–3.07)Too imprecise
- Unintentional injuriesRound 1 · analysis 3347 · nearby or wider cells0.91 (0.25–3.25)Too imprecise
- All road casualties aged 5-18Round 2 · analysis 3380 · same cells as the autism estimate0.75 (0.22–2.42)Too imprecise
- All road casualties aged 5-18Round 2 · analysis 3380 · nearby or wider cells0.75 (0.22–2.42)Too imprecise
- All unintentional-injury admissionsRound 2 · analysis 3380 · same design, cells restricted by year0.92 (0.26–3.05)Too imprecise
Source readings: UNINFORMATIVE (3347)
Northern Ireland Rotavirus
Pooled in the synthesis · autism, own data 1.01 (0.88–1.16)- All road casualtiesRound 2 · analysis 3380 · nearby or wider cells1.02 (0.37–2.04)Consistent with 1
- All unintentional injuries (V01-X59 excl. X30-X39)Round 1 · analysis 3333 · nearby or wider cells1.46 (0.51–3.51)Too imprecise
- All unintentional injuries (V01-X59 excl. X30-X39)Round 1 · analysis 3333 · nearby or wider cells0.86 (0.25–2.76)Too imprecise
- All road casualtiesRound 2 · analysis 3380 · nearby or wider cells1.16 (0.48–2.17)Too imprecise
Canada Rotavirus (Excl. Quebec)
Pooled in the synthesis · autism, own data 0.99 (0.32–1.89)- Asthma incidence (CCDSS, 1-19) (non-injury control)Round 2 · analysis 3384 · same cells as the autism estimate0.71 (0.48–1.06)Consistent with 1
Quebec Rotavirus
Pooled in the synthesis · autism, own data 1.07 (0.74–1.48)No control fitted on this context's own cells; 1 report-only analogue row in the full table.
Czechia MMR
Pooled in the synthesis · autism, own data 1.04 (0.32–3.66)- All Injuries (S00-T98 Excl. T78, T80-T88)Round 2 · analysis 3381 · nearby or wider cells1.19 (0.32–4.48)Too imprecise
Source readings: UNINFORMATIVE (3381)
Brazil Maternal DTaP
Pooled in the synthesis · autism, own data 0.77 (0.51–1.14)- All InjuriesRound 1 · analysis 3332 · same cells as the autism estimate0.51 (0.29–0.83)Bias signal
- All Unintentional Injuries (V01-X59)Round 2 · analysis 3382 · same cells as the autism estimate0.36 (0.15–0.79)Bias signal
- Unintentional injuriesRound 1 · analysis 3347 · design analogue1.08 (0.79–1.40)Consistent with 1
Source readings: DESIGN BIAS DETECTED (r < 1) (3332, 3382); CONSISTENT (3347)Secondary rows with a bias signal: Falls 0.38 (0.15–0.86)
Colombia Varicella
Pooled in the synthesis · autism, own data 0.76 (0.51–1.07)- School census motor / physical disability (non-injury control)Round 1 · analysis 3338 · same cells, observed subset0.87 (0.67–1.28)Consistent with 1
- School census visual disability (non-injury control)Round 1 · analysis 3338 · same cells, observed subset0.90 (0.58–1.27)Consistent with 1
- School census hearing disability (non-injury control)Round 1 · analysis 3337 · same cells, observed subset0.98 (0.66–1.49)Consistent with 1
- Transport Injuries (INMLCF, Non-Fatal)Round 2 · analysis 3385 · same cells, observed subset1.36 (0.99–1.93)Consistent with 1
Source readings: CONSISTENT (3337, 3338)Secondary rows with a bias signal: Transport + Accidental Injuries 1.33 (1.01–1.96)
Tanzania Schedule
Pooled in the synthesis · autism, own data 1.12 (0.54–1.69)- Pupils with albinism (non-injury control)Round 1 · analysis 3339 · same cells as the autism estimate1.00 (0.69–1.28)Consistent with 1
Source readings: CONSISTENT (3339)
U.S. Rotavirus 2006 (Untied)
untied (not pooled) · autism, own data 0.95 (0.76–1.19)- IDEA traumatic brain injuryRound 1 · analysis 3331 · same cells, observed subset2.37 (1.09–4.58)Bias signal
Secondary rows with a bias signal: IDEA hearing impairment (non-injury control) 1.41 (1.07–1.82)
All 549 control rows (452 fitted, 86 reading rows) from 25 analyses
Loading the control estimates…
Sources: negative-control summary, both rounds (3330) · UK injury controls, round 2 · European injury controls, round 2 · Brazil injury-death controls · U.S. injury-death controls · Canada asthma controls · Colombia, Hong Kong, Japan and Taiwan controls
Cross-design agreement
Do designs agree?
Designs that read the same cells share the same counts, exposure reconstruction and trend assumptions. Agreement shows stability across the methods compared. It does not provide independent data replication, and a shared data problem may affect several methods.
601design rows55contexts (20 in the figure)413negative-control rows141robustness rows sharing data16own-data rows that enter the pool
hierarchy pooled context (core; U.S. PCV, RotaShield and rotavirus 2006 share one joint likelihood, 1,469 cells)
Loading the convergence panel…
U.S. PCV (Core)
Hierarchy, Own Data
1.17 (0.97–1.39)
Jump: IDEA States
1.04 (0.88–1.23)
Jump: California
1.03 (0.57–1.85)
Jump: Minnesota
1.23 (0.23–6.48)
Jump: New Hampshire
1.28 (0.48–3.38)
Jump: IDEA National
0.87 (0.48–1.60)
Jump: NSCH Surveys
›
1.93 (0.43–8.58)Jump: NHIS
0.88 (0.28–2.77)
NC: Brain Injury
1.65 (0.77–4.29)
NC: Orthopedic
1.43 (0.91–2.26)
NC: Hearing
1.41 (1.05–1.91)
NC: Visual
1.45 (0.74–2.72)
NC: IDEA TBI
0.84 (0.46–1.35)
NC: NCHS M1 Deaths
2.59 (1.15–5.76)
U.S. RotaShield (Core)
Hierarchy, Own Data
0.87 (0.36–1.83)
Jump: IDEA States
0.84 (0.28–2.55)
Jump: ADDM
‹›
1.13 (0.04–29.4)NC: Brain Injury
‹
0.69 (0.20–2.21)NC: Orthopedic
0.97 (0.31–2.35)
NC: Hearing
1.41 (0.48–3.16)
NC: Visual
1.14 (0.35–2.90)
NC: NCHS M1 Deaths
‹
0.82 (0.17–3.13)U.S. Rotavirus 2006 (Untied)
Hierarchy, Own Data
0.95 (0.76–1.19)
Jump: IDEA Ages 3-5
1.31 (0.74–2.33)
Jump: California
1.22 (0.58–2.55)
Jump: Minnesota
0.94 (0.66–1.33)
Jump: New Hampshire
0.94 (0.33–2.72)
NC: Brain Injury
2.37 (1.09–4.58)
NC: Orthopedic
1.01 (0.70–1.46)
NC: Hearing
1.41 (1.07–1.82)
NC: Visual
1.16 (0.78–1.71)
U.S. Hib Booster Deferral (Not Pooled)
Jump: National
1.06 (0.72–1.55)
Cross-State Pulse
0.99 (0.81–1.21)
U.S. HepA 1999 (Not Pooled)
Jump: IDEA States
1.12 (0.69–1.82)
SDID: 17 States
1.17 (0.27–4.60)
SDID: 11 States
1.00 (0.26–3.71)
SDID: Stacked States
1.18 (0.61–3.24)
SDID: Dose-Response
1.23 (0.81–1.78)
Japan MMR (Core)
Hierarchy, Own Data
0.85 (0.28–2.32)
Cohort Meta (DK, US)
0.96 (0.88–1.05)
Case-Control, Japan
1.04 (0.65–1.67)
NC: All Unintentional
0.86 (0.46–1.61)
NC: Accidents
1.00 (0.41–2.21)
Japan JE (Exploratory)
Block: Grade 1
1.02 (0.87–1.18)
Margin: MEXT Panel
0.97 (0.81–1.15)
SDID: Hokkaido
0.90 (0.61–1.30)
NC: Hear/Vis/Phys, Block
0.91 (0.62–1.31)
England Rotavirus
Hierarchy, Own Data
0.94 (0.86–1.02)
Jump: England
0.95 (0.82–1.10)
NC: Injury Deaths, S
0.57 (0.25–1.22)
NC: Injury Deaths, E
0.80 (0.46–1.32)
NC: HES Diagnosis, S
0.99 (0.57–1.57)
NC: HES Ext. Cause, S
0.98 (0.53–1.60)
NC: STATS19, S
1.00 (0.87–1.16)
Scotland Rotavirus
Hierarchy, Own Data
1.55 (0.38–5.31)
Jump: Scotland + Wales
0.82 (0.25–2.69)
NC: Injury Deaths, S
0.88 (0.24–3.07)
NC: Injury Deaths, E
0.87 (0.32–2.31)
NC: PHS Admissions, S
0.92 (0.26–3.05)
NC: STATS19, S
0.75 (0.22–2.42)
Northern Ireland Rotavirus
Hierarchy, Own Data
1.01 (0.88–1.16)
Jump: Northern Ireland
0.91 (0.73–1.15)
NC: Injury Deaths, S
0.86 (0.25–2.76)
NC: Injury Deaths, E
1.46 (0.51–3.51)
NC: PSNI Casualties, S
1.02 (0.37–2.04)
Canada Rotavirus (Excl. Quebec)
Hierarchy, Own Data
0.99 (0.32–1.89)
SC: Early Adopters
‹›
1.96 (0.00–6.94)SC: ON+QC+BC 2012
‹›
2.19 (0.00–7.36)SC: Ontario
‹
1.76 (0.00–6.42)SC: British Columbia
‹›
4.99 (0.00–12.2)NC: CCDSS Asthma
0.71 (0.48–1.06)
Quebec Rotavirus
Hierarchy, Own Data
1.07 (0.74–1.48)
SC: Quebec (CCDSS)
‹›
1.81 (0.00–7.05)Sweden Rotavirus (Not Pooled)
Block: F84 All Ages
1.30 (0.86–1.90)
Jump: Regions
0.91 (0.45–1.83)
Margin: Counties
0.80 (0.63–1.03)
SDID: Stockholm
‹
0.89 (0.13–3.32)Sweden PCV
Hierarchy, Own Data
1.01 (0.79–1.56)
Block: F84 All Ages
0.98 (0.77–1.26)
Jump: Counties
1.10 (0.25–4.83)
NC: All Injuries (SWE_A)
1.06 (0.98–1.13)
Germany PCV
Hierarchy, Own Data
1.03 (0.27–3.96)
Block: Rebuilt (KVIS)
0.49 (0.21–1.08)
Block: Rebuilt, 16 Länder
0.48 (0.20–1.13)
Jump: Länder
‹›
0.65 (0.02–21.5)NC: All Injuries (DEU_A)
1.09 (0.31–3.91)
Hong Kong PCV
Hierarchy, Own Data
0.89 (0.66–1.16)
NC: Phys.+Vis.+Hear.
1.15 (0.90–1.47)
NC: Physical+Visual
1.50 (1.09–2.22)
NC: Physical
1.78 (1.23–2.90)
NC: Visual
2.01 (0.56–6.06)
NC: Hearing
0.99 (0.72–1.32)
NC: All Injuries
0.89 (0.26–3.74)
NC: Road-Traffic
0.66 (0.48–0.92)
Czechia MMR
Hierarchy, Own Data
1.04 (0.32–3.66)
Cohort Meta (DK, US)
0.96 (0.88–1.05)
NC: All Injuries (CZE_A)
1.19 (0.32–4.48)
Brazil Maternal DTaP
Hierarchy, Own Data
0.77 (0.51–1.14)
Cohort (U.S. Tdap)
0.85 (0.77–0.95)
NC: All Injuries
0.51 (0.29–0.83)
NC: SIM All Unintentional
‹
0.36 (0.15–0.79)Colombia Varicella
Hierarchy, Own Data
0.76 (0.51–1.07)
NC: Hearing
0.98 (0.66–1.49)
NC: Motor/Physical
0.87 (0.67–1.28)
NC: Visual
0.90 (0.58–1.27)
NC: Transport Injuries
1.36 (0.99–1.93)
Tanzania Schedule
Hierarchy, Own Data
1.12 (0.54–1.69)
NC: Albinism
1.00 (0.69–1.28)
Show the values
Flagged rows are drawn hollow and light: no placebo-passing specification, uninformative or artefact per the checker, report-only, exploratory, not eligible, or an uninformative negative control. Intervals are 95% unless stated.
| Context | Design | Type | Estimate (interval) | Interval | Flagged |
|---|---|---|---|---|---|
| U.S. PCV (Core) | Hierarchy, Own Data | Hierarchy, own data | 1.17 (0.97–1.39) | 95% | |
| U.S. PCV (Core) | Jump: IDEA States | Jump | 1.04 (0.88–1.23) | 95% | |
| U.S. PCV (Core) | Jump: California | Jump | 1.03 (0.57–1.85) | 95% | |
| U.S. PCV (Core) | Jump: Minnesota | Jump | 1.23 (0.23–6.48) | 95% | flagged |
| U.S. PCV (Core) | Jump: New Hampshire | Jump | 1.28 (0.48–3.38) | 95% | |
| U.S. PCV (Core) | Jump: IDEA National | Jump | 0.87 (0.48–1.60) | 95% | |
| U.S. PCV (Core) | Jump: NSCH Surveys | Jump | 1.93 (0.43–8.58) | 95% | flagged |
| U.S. PCV (Core) | Jump: NHIS | Jump | 0.88 (0.28–2.77) | 95% | flagged |
| U.S. PCV (Core) | NC: Brain Injury | Negative-control outcome | 1.65 (0.77–4.29) | 95% | flagged |
| U.S. PCV (Core) | NC: Orthopedic | Negative-control outcome | 1.43 (0.91–2.26) | 95% | flagged |
| U.S. PCV (Core) | NC: Hearing | Negative-control outcome | 1.41 (1.05–1.91) | 95% | |
| U.S. PCV (Core) | NC: Visual | Negative-control outcome | 1.45 (0.74–2.72) | 95% | flagged |
| U.S. PCV (Core) | NC: IDEA TBI | Negative-control outcome | 0.84 (0.46–1.35) | 95% | flagged |
| U.S. PCV (Core) | NC: NCHS M1 Deaths | Negative-control outcome | 2.59 (1.15–5.76) | 95% | flagged |
| U.S. RotaShield (Core) | Hierarchy, Own Data | Hierarchy, own data | 0.87 (0.36–1.83) | 95% | |
| U.S. RotaShield (Core) | Jump: IDEA States | Jump | 0.84 (0.28–2.55) | 95% | flagged |
| U.S. RotaShield (Core) | Jump: ADDM | Jump | 1.13 (0.04–29.4) | 95% | flagged |
| U.S. RotaShield (Core) | NC: Brain Injury | Negative-control outcome | 0.69 (0.20–2.21) | 95% | |
| U.S. RotaShield (Core) | NC: Orthopedic | Negative-control outcome | 0.97 (0.31–2.35) | 95% | |
| U.S. RotaShield (Core) | NC: Hearing | Negative-control outcome | 1.41 (0.48–3.16) | 95% | |
| U.S. RotaShield (Core) | NC: Visual | Negative-control outcome | 1.14 (0.35–2.90) | 95% | |
| U.S. RotaShield (Core) | NC: NCHS M1 Deaths | Negative-control outcome | 0.82 (0.17–3.13) | 95% | |
| U.S. Rotavirus 2006 (Untied) | Hierarchy, Own Data | Hierarchy, own data | 0.95 (0.76–1.19) | 95% | |
| U.S. Rotavirus 2006 (Untied) | Jump: IDEA Ages 3-5 | Jump | 1.31 (0.74–2.33) | 95% | |
| U.S. Rotavirus 2006 (Untied) | Jump: California | Jump | 1.22 (0.58–2.55) | 95% | |
| U.S. Rotavirus 2006 (Untied) | Jump: Minnesota | Jump | 0.94 (0.66–1.33) | 95% | |
| U.S. Rotavirus 2006 (Untied) | Jump: New Hampshire | Jump | 0.94 (0.33–2.72) | 95% | |
| U.S. Rotavirus 2006 (Untied) | NC: Brain Injury | Negative-control outcome | 2.37 (1.09–4.58) | 95% | |
| U.S. Rotavirus 2006 (Untied) | NC: Orthopedic | Negative-control outcome | 1.01 (0.70–1.46) | 95% | |
| U.S. Rotavirus 2006 (Untied) | NC: Hearing | Negative-control outcome | 1.41 (1.07–1.82) | 95% | |
| U.S. Rotavirus 2006 (Untied) | NC: Visual | Negative-control outcome | 1.16 (0.78–1.71) | 95% | |
| U.S. Hib Booster Deferral (Not Pooled) | Jump: National | Jump | 1.06 (0.72–1.55) | 95% | |
| U.S. Hib Booster Deferral (Not Pooled) | Cross-State Pulse | Other individual-scale design | 0.99 (0.81–1.21) | 95% | |
| U.S. HepA 1999 (Not Pooled) | Jump: IDEA States | Jump | 1.12 (0.69–1.82) | 95% | |
| U.S. HepA 1999 (Not Pooled) | SDID: 17 States | Synthetic control / SDID | 1.17 (0.27–4.60) | 95% | |
| U.S. HepA 1999 (Not Pooled) | SDID: 11 States | Synthetic control / SDID | 1.00 (0.26–3.71) | 95% | |
| U.S. HepA 1999 (Not Pooled) | SDID: Stacked States | Synthetic control / SDID | 1.18 (0.61–3.24) | 95% | |
| U.S. HepA 1999 (Not Pooled) | SDID: Dose-Response | Synthetic control / SDID | 1.23 (0.81–1.78) | 95% | |
| Japan MMR (Core) | Hierarchy, Own Data | Hierarchy, own data | 0.85 (0.28–2.32) | 95% | |
| Japan MMR (Core) | Cohort Meta (DK, US) | Individual study, other country | 0.96 (0.88–1.05) | 95% | |
| Japan MMR (Core) | Case-Control, Japan | Individual study, other country | 1.04 (0.65–1.67) | 95% | |
| Japan MMR (Core) | NC: All Unintentional | Negative-control outcome | 0.86 (0.46–1.61) | 95% | |
| Japan MMR (Core) | NC: Accidents | Negative-control outcome | 1.00 (0.41–2.21) | 95% | flagged |
| Japan JE (Exploratory) | Block: Grade 1 | Hierarchy block, not pooled | 1.02 (0.87–1.18) | 95% | flagged |
| Japan JE (Exploratory) | Margin: MEXT Panel | Other individual-scale design | 0.97 (0.81–1.15) | 95% | flagged |
| Japan JE (Exploratory) | SDID: Hokkaido | Synthetic control / SDID | 0.90 (0.61–1.30) | 95% | flagged |
| Japan JE (Exploratory) | NC: Hear/Vis/Phys, Block | Negative-control outcome | 0.91 (0.62–1.31) | 95% | |
| England Rotavirus | Hierarchy, Own Data | Hierarchy, own data | 0.94 (0.86–1.02) | 95% | |
| England Rotavirus | Jump: England | Jump | 0.95 (0.82–1.10) | 95% | flagged |
| England Rotavirus | NC: Injury Deaths, S | Negative-control outcome | 0.57 (0.25–1.22) | 95% | flagged |
| England Rotavirus | NC: Injury Deaths, E | Negative-control outcome | 0.80 (0.46–1.32) | 95% | flagged |
| England Rotavirus | NC: HES Diagnosis, S | Negative-control outcome | 0.99 (0.57–1.57) | 95% | |
| England Rotavirus | NC: HES Ext. Cause, S | Negative-control outcome | 0.98 (0.53–1.60) | 95% | |
| England Rotavirus | NC: STATS19, S | Negative-control outcome | 1.00 (0.87–1.16) | 95% | |
| Scotland Rotavirus | Hierarchy, Own Data | Hierarchy, own data | 1.55 (0.38–5.31) | 95% | |
| Scotland Rotavirus | Jump: Scotland + Wales | Jump | 0.82 (0.25–2.69) | 95% | flagged |
| Scotland Rotavirus | NC: Injury Deaths, S | Negative-control outcome | 0.88 (0.24–3.07) | 95% | flagged |
| Scotland Rotavirus | NC: Injury Deaths, E | Negative-control outcome | 0.87 (0.32–2.31) | 95% | |
| Scotland Rotavirus | NC: PHS Admissions, S | Negative-control outcome | 0.92 (0.26–3.05) | 95% | flagged |
| Scotland Rotavirus | NC: STATS19, S | Negative-control outcome | 0.75 (0.22–2.42) | 95% | flagged |
| Northern Ireland Rotavirus | Hierarchy, Own Data | Hierarchy, own data | 1.01 (0.88–1.16) | 95% | |
| Northern Ireland Rotavirus | Jump: Northern Ireland | Jump | 0.91 (0.73–1.15) | 95% | flagged |
| Northern Ireland Rotavirus | NC: Injury Deaths, S | Negative-control outcome | 0.86 (0.25–2.76) | 95% | flagged |
| Northern Ireland Rotavirus | NC: Injury Deaths, E | Negative-control outcome | 1.46 (0.51–3.51) | 95% | flagged |
| Northern Ireland Rotavirus | NC: PSNI Casualties, S | Negative-control outcome | 1.02 (0.37–2.04) | 95% | |
| Canada Rotavirus (Excl. Quebec) | Hierarchy, Own Data | Hierarchy, own data | 0.99 (0.32–1.89) | 95% | |
| Canada Rotavirus (Excl. Quebec) | SC: Early Adopters | Synthetic control / SDID | 1.96 (0.00–6.94) | 90% | |
| Canada Rotavirus (Excl. Quebec) | SC: ON+QC+BC 2012 | Synthetic control / SDID | 2.19 (0.00–7.36) | 90% | |
| Canada Rotavirus (Excl. Quebec) | SC: Ontario | Synthetic control / SDID | 1.76 (0.00–6.42) | 90% | |
| Canada Rotavirus (Excl. Quebec) | SC: British Columbia | Synthetic control / SDID | 4.99 (0.00–12.2) | 90% | |
| Canada Rotavirus (Excl. Quebec) | NC: CCDSS Asthma | Negative-control outcome | 0.71 (0.48–1.06) | 95% | |
| Quebec Rotavirus | Hierarchy, Own Data | Hierarchy, own data | 1.07 (0.74–1.48) | 95% | |
| Quebec Rotavirus | SC: Quebec (CCDSS) | Synthetic control / SDID | 1.81 (0.00–7.05) | 90% | |
| Sweden Rotavirus (Not Pooled) | Block: F84 All Ages | Hierarchy block, not pooled | 1.30 (0.86–1.90) | 95% | flagged |
| Sweden Rotavirus (Not Pooled) | Jump: Regions | Jump | 0.91 (0.45–1.83) | 95% | |
| Sweden Rotavirus (Not Pooled) | Margin: Counties | Other individual-scale design | 0.80 (0.63–1.03) | 95% | flagged |
| Sweden Rotavirus (Not Pooled) | SDID: Stockholm | Synthetic control / SDID | 0.89 (0.13–3.32) | 95% | |
| Sweden PCV | Hierarchy, Own Data | Hierarchy, own data | 1.01 (0.79–1.56) | 95% | |
| Sweden PCV | Block: F84 All Ages | Hierarchy block, not pooled | 0.98 (0.77–1.26) | 95% | flagged |
| Sweden PCV | Jump: Counties | Jump | 1.10 (0.25–4.83) | 95% | flagged |
| Sweden PCV | NC: All Injuries (SWE_A) | Negative-control outcome | 1.06 (0.98–1.13) | 95% | |
| Germany PCV | Hierarchy, Own Data | Hierarchy, own data | 1.03 (0.27–3.96) | 95% | |
| Germany PCV | Block: Rebuilt (KVIS) | Hierarchy block, not pooled | 0.49 (0.21–1.08) | 95% | flagged |
| Germany PCV | Block: Rebuilt, 16 Länder | Hierarchy block, not pooled | 0.48 (0.20–1.13) | 95% | flagged |
| Germany PCV | Jump: Länder | Jump | 0.65 (0.02–21.5) | 95% | flagged |
| Germany PCV | NC: All Injuries (DEU_A) | Negative-control outcome | 1.09 (0.31–3.91) | 95% | flagged |
| Hong Kong PCV | Hierarchy, Own Data | Hierarchy, own data | 0.89 (0.66–1.16) | 95% | |
| Hong Kong PCV | NC: Phys.+Vis.+Hear. | Negative-control outcome | 1.15 (0.90–1.47) | 95% | |
| Hong Kong PCV | NC: Physical+Visual | Negative-control outcome | 1.50 (1.09–2.22) | 95% | |
| Hong Kong PCV | NC: Physical | Negative-control outcome | 1.78 (1.23–2.90) | 95% | |
| Hong Kong PCV | NC: Visual | Negative-control outcome | 2.01 (0.56–6.06) | 95% | flagged |
| Hong Kong PCV | NC: Hearing | Negative-control outcome | 0.99 (0.72–1.32) | 95% | |
| Hong Kong PCV | NC: All Injuries | Negative-control outcome | 0.89 (0.26–3.74) | 95% | flagged |
| Hong Kong PCV | NC: Road-Traffic | Negative-control outcome | 0.66 (0.48–0.92) | 95% | |
| Czechia MMR | Hierarchy, Own Data | Hierarchy, own data | 1.04 (0.32–3.66) | 95% | |
| Czechia MMR | Cohort Meta (DK, US) | Individual study, other country | 0.96 (0.88–1.05) | 95% | |
| Czechia MMR | NC: All Injuries (CZE_A) | Negative-control outcome | 1.19 (0.32–4.48) | 95% | flagged |
| Brazil Maternal DTaP | Hierarchy, Own Data | Hierarchy, own data | 0.77 (0.51–1.14) | 95% | |
| Brazil Maternal DTaP | Cohort (U.S. Tdap) | Individual study, other country | 0.85 (0.77–0.95) | 95% | |
| Brazil Maternal DTaP | NC: All Injuries | Negative-control outcome | 0.51 (0.29–0.83) | 95% | |
| Brazil Maternal DTaP | NC: SIM All Unintentional | Negative-control outcome | 0.36 (0.15–0.79) | 95% | |
| Colombia Varicella | Hierarchy, Own Data | Hierarchy, own data | 0.76 (0.51–1.07) | 95% | |
| Colombia Varicella | NC: Hearing | Negative-control outcome | 0.98 (0.66–1.49) | 95% | |
| Colombia Varicella | NC: Motor/Physical | Negative-control outcome | 0.87 (0.67–1.28) | 95% | |
| Colombia Varicella | NC: Visual | Negative-control outcome | 0.90 (0.58–1.27) | 95% | |
| Colombia Varicella | NC: Transport Injuries | Negative-control outcome | 1.36 (0.99–1.93) | 95% | |
| Tanzania Schedule | Hierarchy, Own Data | Hierarchy, own data | 1.12 (0.54–1.69) | 95% | |
| Tanzania Schedule | NC: Albinism | Negative-control outcome | 1.00 (0.69–1.28) | 95% |
Where the designs agree and disagree, context by context · All 601 rows (CSV)
Combinations and schedule load
What do the combination and timing models test?
A “too many, too soon” claim predicts extra risk when vaccines are combined, or more risk where more doses come early. These are separate questions from the main estimate. The mean interaction estimate is close to 1. The schedule-load and timing estimates remain largely determined by their priors.
Pairs of vaccine exposures
Interaction between vaccine exposures
0.9670.881–1.063, 95% credible interval
The average interaction across 27 vaccine pairs: whether the joint exposure departs from the product of separate effects. An interaction multiplier of 1 means no departure from that product; it does not mean total joint risk is 1. The interval includes 1; its upper endpoint is an average interaction multiplier 6% above 1 under this model. P(> 1.10) = 0.0046; P(> 1.25) = 2.7 × 10⁻⁶. The model’s prediction for a new pair is 0.967 (0.762–1.229).
All 27 pairscombined interaction estimate
0.967 (0.881–1.063)
Without Flu × Hib DeferralH1N1 pair
0.952 (0.868–1.042)
Without U.S. State Pairsleave-one-source-out
‹
0.831 (0.429–1.602)
Without England Pairsleave-one-source-out
0.971 (0.883–1.069)
Without PCV × RotaShieldleave-one-source-out
0.969 (0.882–1.064)
U.S. Pairs IndependentU.S. dependence
1.019 (0.906–1.138)
See all 27 pairs
Varicella × PCV7us state pairs · published 0.976 (0.325–2.924)
0.951 (0.757–1.163)
Varicella × Fluus state pairs · published 1.788 (0.632–5.055)
1.007 (0.837–1.299)
Varicella × Hepatitis Aus state pairs · published 1.535 (0.500–4.706)
0.982 (0.790–1.256)
Varicella × Rotavirusus state pairs · published 0.759 (0.362–1.592)
0.924 (0.734–1.100)
Varicella × Hib Deferralus state pairs · published 1.181 (0.594–2.350)
0.992 (0.823–1.246)
Varicella × PCV13us state pairs · published 0.931 (0.529–1.639)
0.967 (0.795–1.177)
PCV7 × Fluus state pairs · published 0.454 (0.150–1.377)
0.933 (0.731–1.128)
PCV7 × Hepatitis Aus state pairs · published 0.389 (0.101–1.497)
0.968 (0.765–1.207)
PCV7 × Hib Deferralus state pairs · published 0.975 (0.456–2.086)
0.963 (0.766–1.198)
PCV7 × PCV13us state pairs · published 0.608 (0.260–1.421)
0.904 (0.711–1.072)
Flu × Hepatitis Aus state pairs · published 0.921 (0.642–1.320)
0.880 (0.741–1.012)
Flu × Rotavirusus state pairs · published 1.008 (0.696–1.460)
1.002 (0.865–1.167)
Flu × Hib Deferralus state pairs · published 1.501 (1.110–2.030)
1.078 (0.926–1.307)
Flu × PCV13us state pairs · published 1.028 (0.782–1.352)
0.983 (0.854–1.144)
Hepatitis A × Rotavirusus state pairs · published 0.972 (0.687–1.376)
1.007 (0.885–1.161)
Hepatitis A × Hib Deferralus state pairs · published 1.248 (0.822–1.894)
0.973 (0.836–1.146)
Hepatitis A × PCV13us state pairs · published 1.115 (0.594–2.091)
0.951 (0.808–1.131)
Rotavirus × Hib Deferralus state pairs · published 0.844 (0.558–1.277)
0.899 (0.724–1.063)
Rotavirus × PCV13us state pairs · published 1.101 (0.650–1.864)
0.991 (0.843–1.201)
Hib Deferral × PCV13us state pairs · published 1.115 (0.508–2.446)
0.982 (0.818–1.209)
MMR Dose 2 × Hepatitis Bus state pairs · published 0.967 (0.688–1.360)
0.995 (0.858–1.173)
MMR Dose 2 × Varicellaus state pairs · published 0.627 (0.254–1.549)
0.982 (0.791–1.226)
MMR Dose 2 × Hepatitis Aus state pairs · published 1.059 (0.489–2.293)
0.975 (0.789–1.214)
Hepatitis B × Varicellaus state pairs · published 1.687 (0.434–6.567)
0.968 (0.777–1.217)
Rotavirus → MenB (England)england pairs · published 0.706 (0.238–2.101)
0.958 (0.754–1.195)
MMR → Rotavirus (England)england pairs · published 0.947 (0.402–2.230)
0.964 (0.767–1.203)
PCV × RotaShield (U.S. Core)us core eta3 · published 0.792 (0.224–2.848)
0.963 (0.755–1.216)
Main autism synthesis (17 contexts): 0.987 (0.638–1.519). This is an average exposure effect; the interaction multiplier measures departure from multiplicative separate effects. They are not multiplied together. Main synthesis · Interaction methods and inputs
Schedule load and timing
Does risk rise with more antigens or injections due early?
This meta-regression uses 10 pooled contexts with a verified schedule load, rather than the full cohort dataset. Their early schedules span a narrow range, and the intervals below remain close to their starting assumptions. It provides little precision about load dependence in this subset.
Antigensratio per +5 antigens due by the first dose
0.999 (0.507–1.965) after the data, against 0.507–1.972 before. Posterior width is 100% of the prior’s: these data add little precision beyond the prior.
Injectionsratio per +5 injections due by the first dose
0.982 (0.516–1.865) after the data, against 0.507–1.972 before. Posterior width is 94% of the prior’s: these data add little precision beyond the prior.
Age at first doseratio per +10 months of age at first dose
0.906 (0.321–2.523) after the data, against 0.322–3.102 before. Posterior width is 91% of the prior’s: these data add little precision beyond the prior.
prior interval after the data · scale 0.25 to 4, logarithmic
Do contexts with the same vaccine agree?
| Vaccine | Contexts | Heterogeneity test | Verdict |
|---|---|---|---|
| Modern rotavirus | 5 | Q = 1.93, df 4, p = 0.75 | Contexts agree |
| Modern rotavirus + U.S. 2006 | 6 | Q = 1.94, df 5, p = 0.86 | Contexts agree |
| Pneumococcal (PCV) | 4 | Q = 2.64, df 3, p = 0.45 | Contexts agree |
| MMR | 2 | Q = 1.03, df 1, p = 0.31 | Contexts agree |
U.S. PCV, 1.165 (0.973–1.395) on its own data, against the other PCV contexts pooled, 0.947 (0.791–1.137): conflict p = 0.108, consistent under the stated comparison rule. With two to six settings per vaccine, this test can detect only large conflicts.
Beyond autism
Other outcomes need their own evidence
Supplement S47–S51 examines diabetes, obesity and asthma. S69 combines published rotavirus–diabetes and coeliac associations with explicit participant-overlap and dose-definition sensitivities. These are secondary analyses. Some show positive associations; each is listed with its checks and limits.
Rotavirus, diabetes and coeliac diseaseVector figure · twelve overlapping synthesis families, including dependence and HR/RR sensitivitiesChronic-outcome figureVector graphic · selected findings, including positive associations and failed diagnosticsComplete chronic figures · 1 of 3Diabetes incidence and age-gradient comparisonsComplete chronic figures · 2 of 3Obesity, asthma, and published rotavirus–diabetes cohort studiesComplete chronic figures · 3 of 3Danish outcome families and Norwegian program/placebo cutoffsSweden · childhood diabetes72 correlated specifications. Short-series uncertainty and limited power prevent a precise exclusion claim.Austria · type 1 and type 2 diabetes106 published rate/SE pairs; overlapping age/sex summaries, not independent populations or vaccine effects.Finland · cohort and sex comparisons24 descriptive ratios and eight direct sex comparisons. Earlier and later cohorts both have lower youngest-age rates than the reference.Additional evidence registerSource-linked chronic-outcome files, interpretation and checks. Separate from the frozen event inventory.
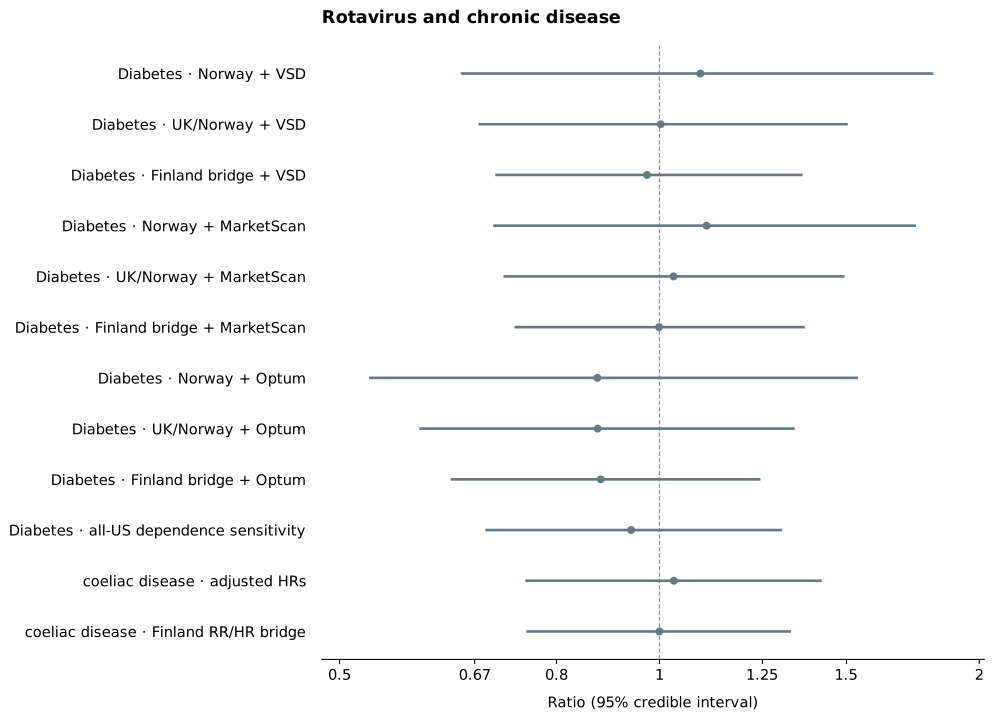
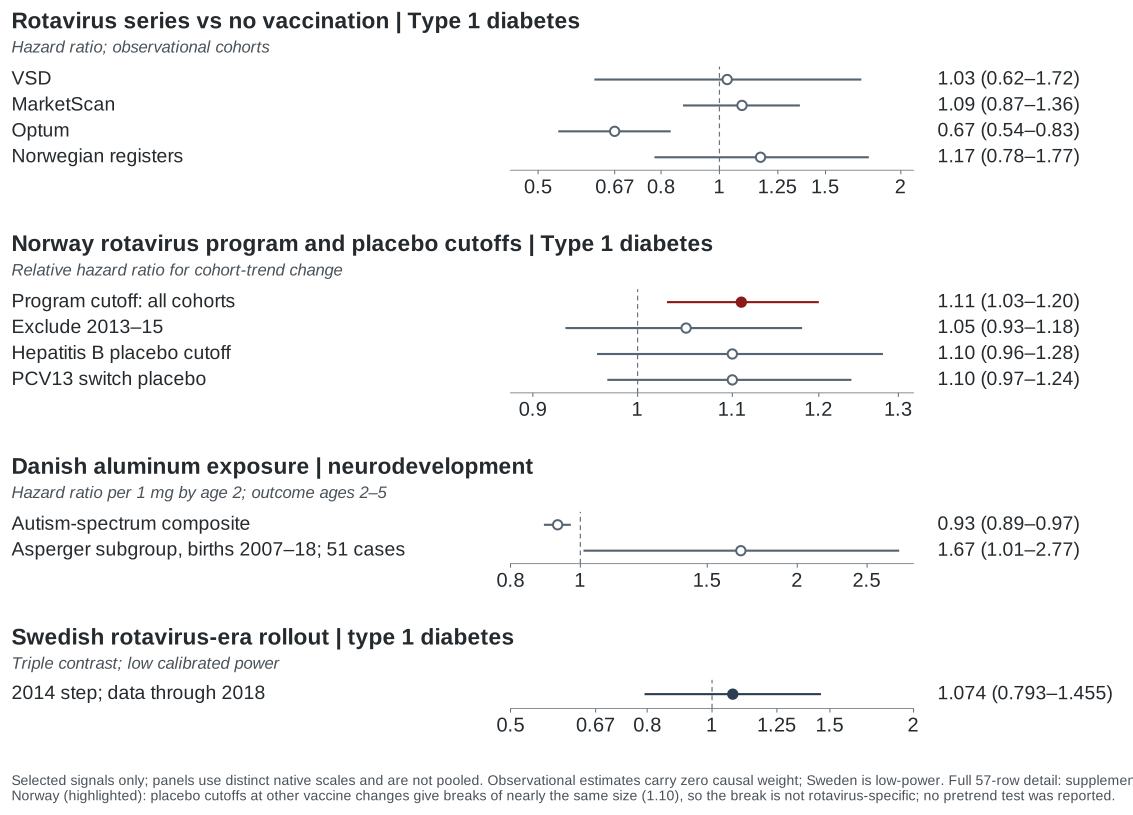
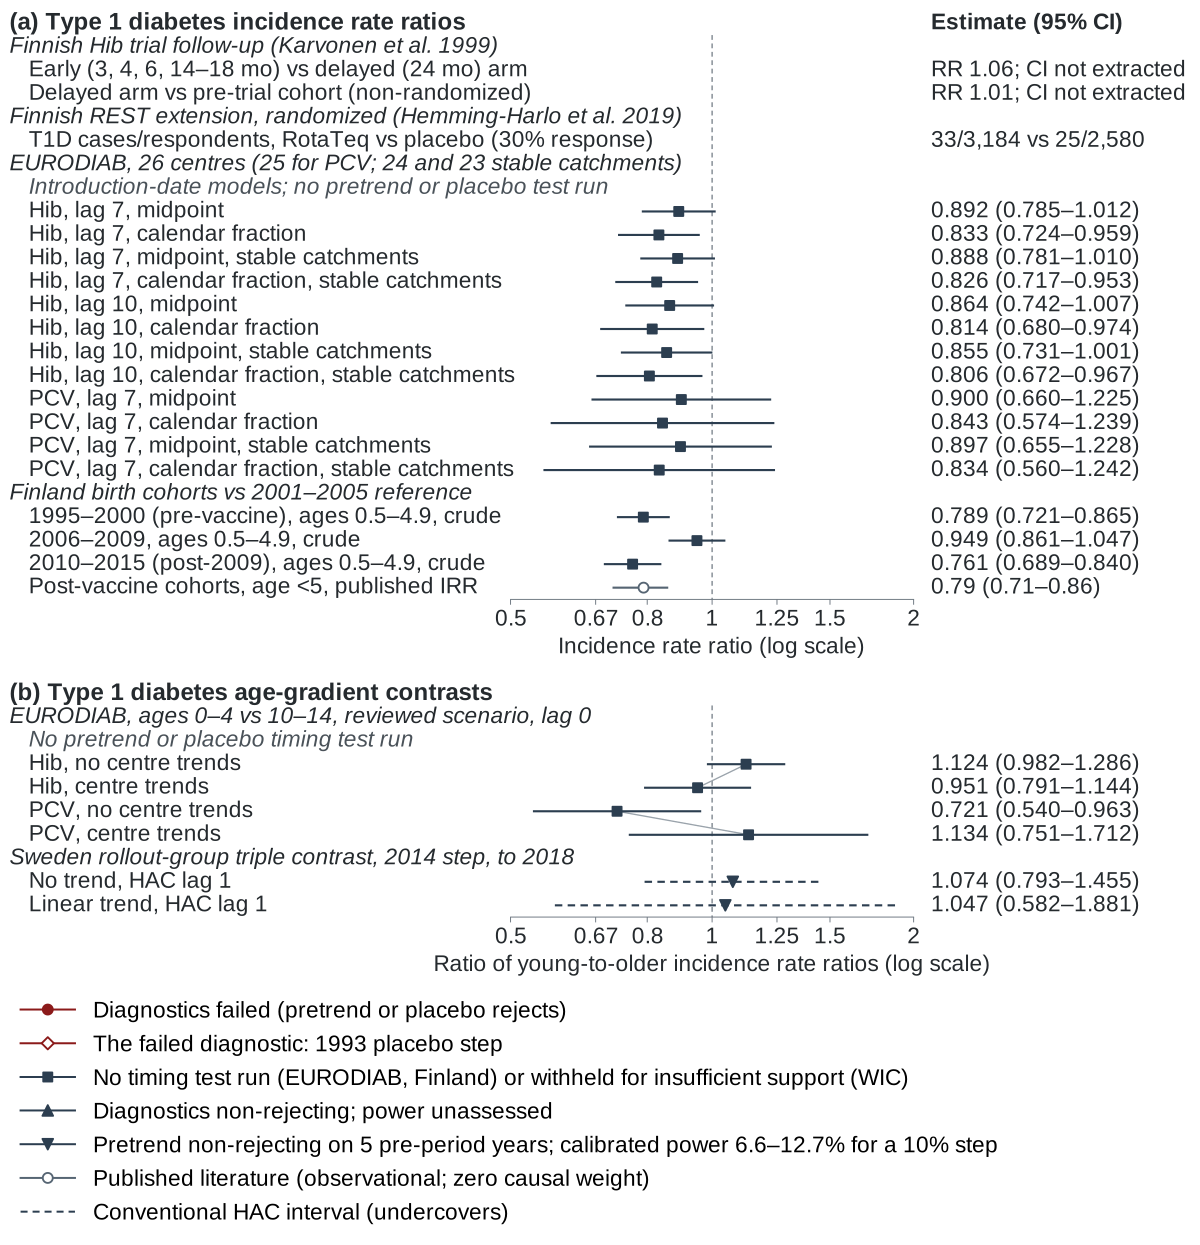
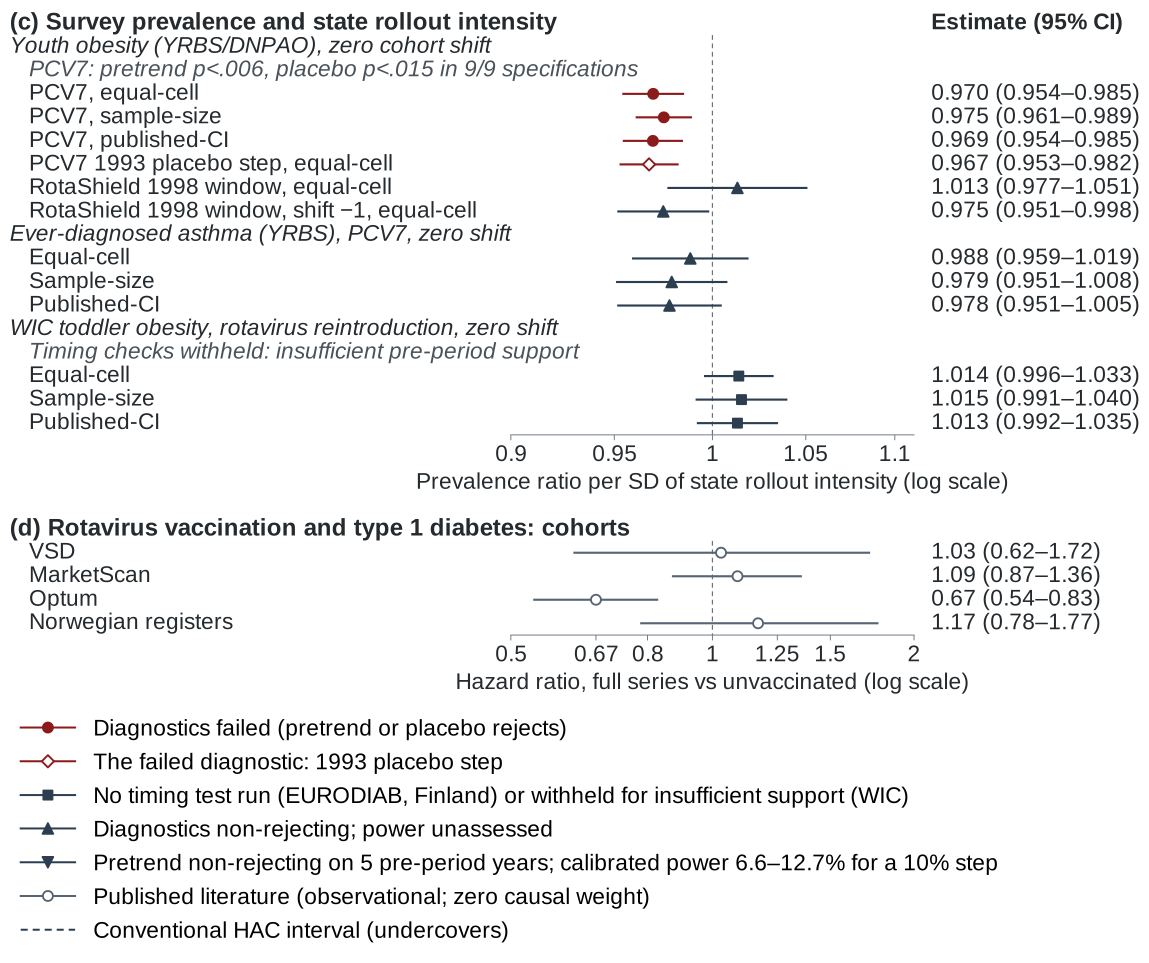
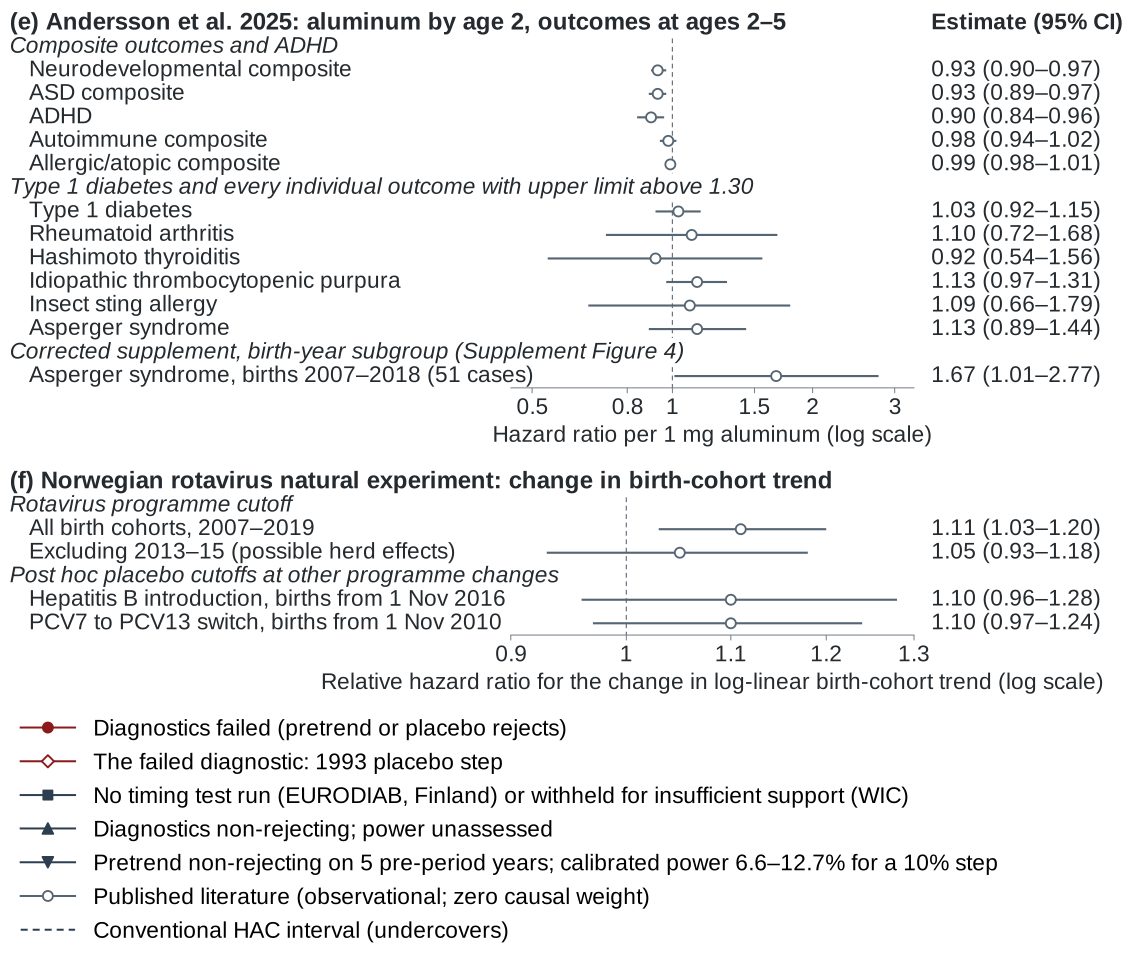
Examining positive associations
Which analyses suggest higher risk?
The register contains 154 rows selected by the documented harm-direction screening rules, with their diagnostics and sources. Multiple testing can generate chance findings, but does not establish that a particular association is false. Ratios are compared with 1, log effects with 0.
154signals93on autism outcomes893309 jump-program signal39chronic outcome: project panel estimate9global-integration block posterior (unpooled)9chronic outcome: published literature
The result register has 60,844 rows, many of them dependent specifications, so a nominally significant row is weak evidence on its own. Jump-program tiers describe which interval is positive: 1, the headline; 2, another specification; 3, an uncalibrated interval only. The combined register and published-contrast tables also keep the null and inverse estimates.
Loading the register…
Individual comparisons
Compare the estimates on their stated scales
Each dot is shown on its own stated scale. A value of 1.00 means no difference, but estimates with different exposure units are not interchangeable or automatically poolable.
PCV7 rollout across U.S. statesRR per 1 SD higher early uptake
1.013 (0.981–1.046)Model-native MDE 1.047; not individual-risk powerExposure-aligned harm injections fail the positive-direction mapping (S52)
RotaShield uptake pulse across U.S. statesRR per 10-percentage-point uptake difference
0.996 (0.945–1.051)Familywise 80% MDE: RR 1.096; exposure uncertainty includedLimited by one clean pre-exposure cohort
PCV7 outcome-category comparisonAutism change relative to other education categories
0.995 (0.952–1.040)80% MDE: RR 1.065Not an automatic negative control; PCV7 exposure mapping also requires validation
PCV7 rollout in six U.S. autism-monitoring sitesRR per 1 SD higher early uptake
1.053 (0.971–1.143)Small-cluster sensitivity; 80% MDE: ratio 1.118 per six-site uptake SD (2.35 percentage points)Separate outcome system, but only six sites
MMR withdrawal in JapanRR per 10-percentage-point MMR coverage difference
0.981 (0.805–1.196)Low power; 80% MDE: RR 1.619Nine aggregate cohorts; limited population-level comparison
PCV7 introduction-cohort curvature in four non-overlapping data spinesModified-HKSJ summary of fixed-age slope changes in California, Minnesota, New Jersey, and Japan
0.983 (0.928–1.043)Four mutually exclusive data spines; federal IDEA omitted to avoid overlapSlope-change estimand; not a coverage-gradient or individual risk ratio
Kindergarten MMR coverage across 12 statesRatio of autism shares among special-education students per +10 coverage points
0.998 (0.946–1.054)Conditional ecological association; not population-autism powerDenominator-specific synthesis; shared-bias sensitivity; no individual-risk conversion
Departure from log additivity across five ecological interaction contrastsInteraction term, not the total incremental effect of adding a vaccine
1.009 (0.953–1.074)Ecological interaction sensitivity; not cumulative-load or individual-risk powerCross-design interaction sensitivity; zero omnibus causal weight
One result at a time
What each comparison found—and how much weight it deserves
Passing one diagnostic is not the same as satisfying the full design. Weak first stages, short pre-periods, outcome changes, and low power remain visible here.
14matching estimates
Informative but limited
Japan: MMR withdrawal
Yokohama/Kohoku · Birth cohorts with different MMR coverage, adjusted for the existing cohort trend
0.98195% CI 0.805–1.196
- What is compared
- Rate ratio for a 10-percentage-point coverage difference
- Autism measure
- All autism spectrum diagnoses
- Precision
- 80% MDE: RR 1.619 · power at RR 1.10: 3.2%familywise two-sided noncentral-t power
- Interval
- Plug-in exposure; cluster-robust 95% interval
Only nine aggregate birth cohorts, with coverage and autism measured in different parts of Yokohama.
Diagnostic only: design check failed
Spain: regional varicella policy change
Spain regions · Early- and late-adopting regions compared before and after the policy change
0.57395% CI 0.296–1.112
- What is compared
- Late-adopting versus early-adopting regions after the policy change
- Autism measure
- Autism or pervasive developmental disorder among pupils with special needs
- Precision
- 80% MDE: RR 2.542 · power at RR 1.10: 5.9%familywise clustered design power
- Interval
- Plug-in exposure; cluster-robust 95% interval
Only three early-adopting comparison regions, and the education outcome changed differently before the policy change.
Informative but limited
United States: RotaShield uptake pulse
U.S. states · States with larger uptake pulses compared across birth cohorts
0.99695% CI 0.945–1.051
- What is compared
- Rate ratio for a 10-percentage-point uptake difference
- Autism measure
- Autism recorded in U.S. special-education data at age eight
- Precision
- 80% MDE: RR 1.096 · power at RR 1.10: 83.3%Power uses the matching design alpha (0.0125) and exposure-sampling sensitivity
- Interval
- 95% interval includes archived exposure-sampling uncertainty
Only one clearly pre-exposure cohort, and historical uptake had to be reconstructed.
Diagnostic only: exposure mapping unresolved
United States: PCV7 rollout
U.S. states · States with faster rollouts compared across birth cohorts
1.01395% CI 0.981–1.046
- What is compared
- Rate ratio for a one-standard-deviation difference in early uptake
- Autism measure
- Autism recorded in U.S. special-education data at age eight
- Precision
- 80% MDE: RR 1.047 · power at RR 1.10: 100.0%Power uses the matching design alpha (0.05) and exposure-sampling sensitivity; model-native coefficient power only, not individual-risk power
- Interval
- 95% interval includes archived exposure-sampling uncertainty
Partly exposed reference cohorts and residualized exposure differences prevent a simple individual-risk translation. Other outcome categories are not automatic negative controls.
Diagnostic only: exposure mapping unresolved
United States: did diagnoses shift between education categories?
U.S. states · Autism compared with other education categories across rollout cohorts
0.99595% CI 0.952–1.040
- What is compared
- Change in autism relative to other education categories
- Autism measure
- Autism compared with intellectual-disability and speech categories
- Precision
- 80% MDE: RR 1.065 · power at RR 1.10: 99.0%conditional cluster-robust analytic power; model-native coefficient power only, not individual-risk power
- Interval
- Plug-in exposure; cluster-robust 95% interval
Partly exposed reference cohorts and residualized exposure differences prevent a simple individual-risk translation. Other outcome categories are not automatic negative controls.
Informative but limited
United States: kindergarten MMR coverage
U.S. states · State birth cohorts with different kindergarten MMR coverage
0.98995% CI 0.930–1.052
- What is compared
- RR per +10pp kindergarten MMR coverage
- Autism measure
- Autism recorded in U.S. special-education data at age eight
- Precision
- 80% MDE: RR 1.091 · power at RR 1.10: 86.3%conditional cluster-robust analytic power
- Interval
- Plug-in exposure; cluster-robust 95% interval
Only three recent cohorts are available, so pre-change trends and moderate effects are estimated imprecisely.
Informative but limited
United States: PCV7 replication in autism-monitoring sites
six recurring ADDM sites · Autism-monitoring sites with faster rollouts compared across birth cohorts
1.05395% CI 0.971–1.143
- What is compared
- Rate ratio per one six-site standard deviation (2.35 points) of early uptake (per ten points: 1.247, 0.881-1.766; extrapolated beyond the six sites' 7.2-point range)
- Autism measure
- Records-based autism prevalence at age eight
- Precision
- 80% MDE: RR 1.114 · power at RR 1.10: 66.8%six-site cluster-t power against RR 1.10 per six-site SD (2.35 pp), not per the 51-state 8.91 pp SD; exact wild p reported; by exact noncentral t, power against RR 1.10 is 10.0% per 51-state SD (8.91 points; MDE 1.527) and 8.9% per 10 points (MDE 1.608)
- Interval
- Plug-in exposure; cluster-robust 95% interval
Only six monitoring sites and two usable pre-rollout comparisons; site catchment areas may also have changed.
Informative but limited
United States: RotaShield replication in autism-monitoring sites
six recurring ADDM sites · Autism-monitoring sites with larger uptake pulses compared across birth cohorts
0.97695% CI 0.645–1.476
- What is compared
- RR per +10pp measured uptake
- Autism measure
- Records-based autism prevalence at age eight
- Precision
- 80% MDE: RR 1.733 · power at RR 1.10: 2.5%six-site cluster-t power
- Interval
- Plug-in exposure; cluster-robust 95% interval
One exposed birth cohort and six sites provide very little power to detect a 10% increase.
Diagnostic only: design check failed
England: rotavirus introduction across school ages
England · Eligible and earlier birth cohorts compared across school ages
0.94095% CI 0.891–0.993
- What is compared
- Fully eligible cohorts versus earlier cohorts
- Autism measure
- Autism recorded as the pupil's primary educational need
- Precision
- 80% MDE: RR 1.079 · power at RR 1.10: 94.2%conditional cohort-cluster analytic power
- Interval
- Plug-in exposure; cluster-robust 95% interval
Age, calendar year, and birth cohort cannot be cleanly separated in this pooled-age series; the data source also changes.
Informative but limited
England: rotavirus introduction at age eight
England · Eligible and earlier birth cohorts compared at the same age
1.00495% CI 0.935–1.077
- What is compared
- Fully eligible cohorts versus earlier cohorts
- Autism measure
- Autism recorded as the primary educational need at age eight
- Precision
- 80% MDE: RR 1.097 · power at RR 1.10: 82.2%normal approximation from reported SE
- Interval
- Plug-in exposure; cluster-robust 95% interval
A single national time series is available, with no unaffected comparison population.
Informative but limited
Scotland: local rotavirus uptake
Scottish local authorities · Local authorities with different uptake compared over time
1.02095% CI 0.567–1.833
- What is compared
- Fully exposed cohort share at one standard deviation higher uptake
- Autism measure
- Autism recorded in additional-support-needs data
- Precision
- 80% MDE: RR 2.291 · power at RR 1.10: 5.3%conditional cluster-robust analytic power
- Interval
- Plug-in exposure; cluster-robust 95% interval
Recent local uptake is only a proxy for historical uptake, and the estimate is very imprecise.
Diagnostic only: design check failed
Wales: first rotavirus-eligible cohorts
Welsh local authorities · Local authorities with different uptake compared over time
0.87595% CI 0.489–1.566
- What is compared
- Fully exposed cohort share at one standard deviation higher uptake
- Autism measure
- Autism recorded in additional-learning-needs data
- Precision
- 80% MDE: RR 2.265 · power at RR 1.10: 4.9%conditional cluster-robust analytic power
- Interval
- Plug-in exposure; cluster-robust 95% interval
A change in the Welsh education-recording system coincides with the comparison, and only two clean pre-periods are available.
Diagnostic only: design check failed
Northern Ireland: rotavirus-eligible school cohorts
Northern Ireland grades · Eligible and earlier cohorts compared within school grades
1.07895% CI 0.915–1.271
- What is compared
- Fully exposed cohorts versus earlier cohorts
- Autism measure
- School-age autism prevalence
- Precision
- 80% MDE: RR 1.265 · power at RR 1.10: 20.6%analytic power; wild-cluster MC also reported
- Interval
- Plug-in exposure; cluster-robust 95% interval
Age, period, and cohort are inseparable here, and the autism register changes in 2019/20.
Diagnostic only: design check failed
Sweden: regional PCV rollout
Swedish counties · Regions with different rollout timing compared by year and age
0.88695% CI 0.708–1.109
- What is compared
- Fully exposed cohorts versus earlier cohorts
- Autism measure
- Patients receiving specialist autism care each year
- Precision
- 80% MDE: RR 1.378 · power at RR 1.10: 13.3%conditional cluster-robust analytic power
- Interval
- Plug-in exposure; cluster-robust 95% interval
Annual specialist-care use is not autism prevalence, and five-year age bands blur the first exposed cohorts.
Interpreting uncertainty
Why no single probability of vaccine harm?
The estimates answer different questions and reuse some populations. More importantly, the PCV7 spline can move in the wrong direction when harmful exposure effects are simulated. Pooling it under a positive-direction assumption does not yield a valid probability of harm.
What the intervals do tell us
Read each interval on its stated exposure and outcome scale. Exposure alignment, catch-up vaccination and counterfactual assumptions determine whether it constrains a causal effect. Dependence corrections and alternative priors cannot repair a failed exposure mapping.
Supplement S52 explains the audit. Archived numerical scenarios remain available for inspection, not as vaccine-risk probabilities.
Birth cohorts around schedule changes
Did autism move when vaccine exposure changed?
Choose a comparison, then hover or keyboard-focus a cohort to see its estimate and uncertainty.
What happened to the first exposed cohorts?
PCV7 rollout across U.S. states
Autism recorded at age eight; faster-uptake states compared with slower-uptake states.
Hover or focus a pointA rate ratio of 1.00 means no difference; vertical lines are 95% intervals.
0.8
0.9
1.0
1.1
1.2
First cohort affected by rollout
-3
-2
-1
0
+1
+2
+3
Test for a difference before rollout: p = 0.636The omitted comparison cohort is fixed at 1.00.
View chart data
| Cohort relative to rollout | Rate ratio | 95% interval | Role |
|---|---|---|---|
| -3 | 0.991 | 0.962–1.021 | pretrend |
| -2 | 1.003 | 0.977–1.028 | pretrend |
| -1 | 1.000 | 1.000–1.000 | reference_pre |
| 0 | 1.019 | 0.991–1.048 | post |
| +1 | 1.016 | 0.978–1.055 | post |
| +2 | 1.009 | 0.964–1.057 | post |
| +3 | 1.018 | 0.971–1.068 | post |
A transparent withdrawal illustration
Japan: MMR coverage fell while recorded autism rose
Observed autism diagnoses per 10,000 and MMR coverage are aligned by birth cohort. Counterfactual dots hold the underlying unexposed identification rate at its 1988 level.
50% higher riskColored points show the vaccine-attributable path under the selected risk ratio and a fixed 1988 background identification rate.
0
50
100
150
200
1988
1990
1992
1994
1996
70%
43%
34%
24%
2%
0%
0%
0%
0%
Bars: MMR coverage (%)Observed-rate intervals are 95%.Illustration assumes an unchanged 1988 background identification rate; it is not an adjusted causal estimate.
Nine-cohort coverage-plus-trend estimate: RR 0.981 per 10-percentage-point higher MMR coverage (95% CI 0.805–1.196). Exposure is citywide; outcomes are from one ward. Honda et al. (2005) · full specification and masking audit
See the rising-background sensitivity
aObserved vs predicted decline
MMR coverage 0% from 1993
bRequired masking acceleration
Entire secular growth, 1988–96 (14.0%/yr)6.2%11.2%19.1%
Show the values
| Birth cohort | Observed per 10,000 | 95% interval | MMR coverage | Predicted, RR 1.2 | Predicted, RR 1.5 | Predicted, RR 2.0 |
|---|---|---|---|---|---|---|
| 1988 | 47.6 | 29.6–76.6 | 69.8% | 47.6 | 47.6 | 47.6 |
| 1989 | 52.4 | 32.6–84.2 | 42.9% | 45.4 | 42.9 | 40.1 |
| 1990 | 85.9 | 60.1–122.9 | 33.6% | 44.6 | 41.2 | 37.5 |
| 1991 | 55.8 | 36.4–85.6 | 24.0% | 43.8 | 39.5 | 34.8 |
| 1992 | 63.3 | 42.1–95.3 | 1.8% | 41.9 | 35.6 | 28.5 |
| 1993 | 96.7 | 69.5–134.7 | 0.0% | 41.8 | 35.3 | 28.0 |
| 1994 | 161.3 | 126.0–206.5 | 0.0% | 41.8 | 35.3 | 28.0 |
| 1995 | 115.1 | 83.0–159.6 | 0.0% | 41.8 | 35.3 | 28.0 |
| 1996 | 117.2 | 84.6–162.5 | 0.0% | 41.8 | 35.3 | 28.0 |
| Candidate individual RR | Predicted population change at full withdrawal | Extra untreated growth needed to mask it |
|---|---|---|
| 1.1 | −6.5% | 1.4% per year |
| 1.2 | −12.2% | 2.6% per year |
| 1.5Marked on the chart | −25.9% | 6.2% per year |
| 2Marked on the chart | −41.1% | 11.2% per year |
| 3Marked on the chart | −58.3% | 19.1% per year |
| 4 | −67.7% | 25.3% per year |
Entire secular growth, 1988–96: 14.0% per year (95% interval 5.7–22.9). Predicted paths assume an unchanged 1988 background identification rate; they are an illustration, not an adjusted causal estimate.
The right panel asks how quickly the background diagnosis rate would have to accelerate to hide each candidate harmful effect. It is a stress test of that assumption.
View chart data
| Birth cohort | Autism diagnoses per 10,000 | 95% interval | MMR coverage |
|---|---|---|---|
| 1988 | 47.6 | 29.6–76.6 | 69.8% |
| 1989 | 52.4 | 32.6–84.2 | 42.9% |
| 1990 | 85.9 | 60.1–122.9 | 33.6% |
| 1991 | 55.8 | 36.4–85.6 | 24.0% |
| 1992 | 63.3 | 42.1–95.3 | 1.8% |
| 1993 | 96.7 | 69.5–134.7 | 0.0% |
| 1994 | 161.3 | 126.0–206.5 | 0.0% |
| 1995 | 115.1 | 83.0–159.6 | 0.0% |
| 1996 | 117.2 | 84.6–162.5 | 0.0% |
Publication-formatted figures and the complete robustness atlas remain available in the manuscript and supplement downloads.
Schedule changes around the world
Vaccine introductions, withdrawals and schedule changes
Compare schedule changes and their linked estimates. A rate ratio below 1.00 indicates a lower rate; above 1.00, a higher rate. Each result is labelled to distinguish stronger comparisons from diagnostic or limited analyses.
… linked records with estimates… distinct analysis units… current event records3,391 linked policy episodes
…matching events
| Country | Vaccine or product | Year | Schedule change | Autism ratio estimate |
|---|---|---|---|---|
| Loading the event estimates… | ||||
Additional country-level evidence
66 datasets from 32 countries
These results broaden the evidence base but are generally less decisive than the schedule-change comparisons above. Multiple estimates from one dataset are not counted as independent studies.
France3 datasets · 74 analyses4,593 model specifications · FRA
Switzerland3 datasets · 35 analyses1,336 model specifications · CHE
Estonia2 datasets · 123 analyses1,032 model specifications · EST
Kenya1 dataset · 88 analyses594 model specifications · KEN
Netherlands4 datasets · 62 analyses498 model specifications · NLD
South Korea3 datasets · 35 analyses476 model specifications · KOR
Taiwan2 datasets · 70 analyses422 model specifications · TWN
Sweden6 datasets · 73 analyses420 model specifications · SWE
Canada5 datasets · 45 analyses404 model specifications · CAN
Nigeria2 datasets · 48 analyses396 model specifications · NGA
Latvia1 dataset · 77 analyses356 model specifications · LVA
South Africa1 dataset · 108 analyses324 model specifications · ZAF
United Kingdom8 datasets · 29 analyses257 model specifications · GBR
Brazil3 datasets · 15 analyses218 model specifications · BRA
Chile1 dataset · 76 analyses152 model specifications · CHL
Lithuania2 datasets · 32 analyses128 model specifications · LTU
Tanzania1 dataset · 40 analyses120 model specifications · TZA
Poland2 datasets · 20 analyses97 model specifications · POL
Peru1 dataset · 4 analyses80 model specifications · PER
Slovenia1 dataset · 7 analyses70 model specifications · SVN
Argentina1 dataset · 1 analyses48 model specifications · ARG
Türkiye1 dataset · 5 analyses25 model specifications · TUR
Belgium1 dataset · 8 analyses24 model specifications · BEL
Germany1 dataset · 3 analyses16 model specifications · DEU
Czechia2 datasets · 11 analyses15 model specifications · CZE
Croatia1 dataset · 1 analyses15 model specifications · HRV
Colombia1 dataset · 1 analyses9 model specifications · COL
Hong Kong1 dataset · 1 analyses9 model specifications · HKG
Australia2 datasets · 2 analyses8 model specifications · AUS
Norway1 dataset · 2 analyses8 model specifications · NOR
Romania1 dataset · 2 analyses6 model specifications · ROU
Finland1 dataset · 1 analyses2 model specifications · FIN
Additional country-level results
Browse results from 66 datasets
The datasets yield 1,099 vaccine–outcome analysis families. Most are association checks rather than schedule-change designs, so they supplement rather than drive the main conclusion.
1,099matching analyses
| Country | Vaccine measures | Reported outcomes | Effect summary | How to interpret it |
|---|---|---|---|---|
| ArgentinaARG | MMRMMRArgentina province MMR disability | Other disability or health outcomeschool disability enrollment rate | 1.022Median model estimateRange across compatible specifications: 0.927–1.485Source-reported RR (native exposure units not stated)48 specifications on this scale 48 valid of 48 ratio rows48 ratio rows retain source-reported units because no native exposure unit was stated | Association only; not tied to a schedule change |
| AustraliaAUS | Combined schedulecomplete scheduleAustralia AIR NDIS long panel | Autismautism share among active NDIS primary-disability records | 1.056Median model estimateRange across compatible specifications: 1.023–1.092approximate RR per 10-percentage-point coverage4 specifications on this scale 4 valid of 4 ratio rows | Association only; not tied to a schedule change |
| AustraliaAUS | Combined schedulecomplete scheduleAustralia AIR NDIS | AutismAutism share among active NDIS participants | 1.096Median model estimateRange across compatible specifications: 1.032–1.145Source-reported ratio (native exposure units not stated)4 specifications on this scale 4 valid of 4 ratio rows4 ratio rows retain source-reported units because no native exposure unit was stated | Association only; not tied to a schedule change |
| BelgiumBEL | MeningococcalMenC 1Flanders vaccine type9 change | Other disability or health outcomeshare of special % | 0.457Median native additive estimateRange across compatible specifications: 0.184–0.730outcome-rate change per 1-percentage-point coverage2 specifications on this scale 2 valid native-additive specifications; summaries never mix effect units | Association only; not tied to a schedule change |
| BelgiumBEL | MeningococcalMenC 1Flanders vaccine type9 change | Other reported outcomeall disability categories per 10,000 | 7.957Median native additive estimateRange across compatible specifications: 6.587–9.327outcome-rate change per 1-percentage-point coverage2 specifications on this scale 2 valid native-additive specifications; summaries never mix effect units | Association only; not tied to a schedule change |
| BelgiumBEL | MMRMMR 1Flanders vaccine type9 change | Other disability or health outcomeshare of special % | 0.053Median native additive estimateRange across compatible specifications: -0.253–0.694outcome-rate change per 1-percentage-point coverage6 specifications on this scale 6 valid native-additive specifications; summaries never mix effect units | Association only; not tied to a schedule change |
| BelgiumBEL | MMRMMR 1Flanders vaccine type9 change | Other reported outcomeall disability categories per 10,000 | -0.806Median native additive estimateRange across compatible specifications: -3.478–9.820outcome-rate change per 1-percentage-point coverage6 specifications on this scale 6 valid native-additive specifications; summaries never mix effect units | Association only; not tied to a schedule change |
| BelgiumBEL | Pneumococcal (PCV)Pnc 3Flanders vaccine type9 change | Other disability or health outcomeshare of special % | 0.364Median native additive estimateRange across compatible specifications: 0.305–0.424outcome-rate change per 1-percentage-point coverage2 specifications on this scale 2 valid native-additive specifications; summaries never mix effect units | Association only; not tied to a schedule change |
| BelgiumBEL | Pneumococcal (PCV)Pnc 3Flanders vaccine type9 change | Other reported outcomeall disability categories per 10,000 | 3.710Median native additive estimateRange across compatible specifications: 3.693–3.728outcome-rate change per 1-percentage-point coverage2 specifications on this scale 2 valid native-additive specifications; summaries never mix effect units | Association only; not tied to a schedule change |
| BelgiumBEL | RotavirusRota 2Flanders vaccine type9 change | Other disability or health outcomeshare of special % | 0.205Median native additive estimateRange across compatible specifications: 0.084–0.326outcome-rate change per 1-percentage-point coverage2 specifications on this scale 2 valid native-additive specifications; summaries never mix effect units | Association only; not tied to a schedule change |
| BelgiumBEL | RotavirusRota 2Flanders vaccine type9 change | Other reported outcomeall disability categories per 10,000 | 2.584Median native additive estimateRange across compatible specifications: 1.921–3.246outcome-rate change per 1-percentage-point coverage2 specifications on this scale 2 valid native-additive specifications; summaries never mix effect units | Association only; not tied to a schedule change |
| BrazilBRA | DTP / DTaPmaternal DTaPBrazil maternal DTaP autism | Autismautism | 1.000Median model estimateRange across compatible specifications: 0.990–1.019Source-reported RR (native exposure units not stated)20 specifications on this scale 20 valid of 20 ratio rows20 ratio rows retain source-reported units because no native exposure unit was stated | Association only; not tied to a schedule change |
| BrazilBRA | DTP / DTaPmaternal DTaPBrazil maternal DTaP autism | Other disability or health outcomeany disability | 1.004Median model estimateRange across compatible specifications: 1.000–1.019Source-reported RR (native exposure units not stated)10 specifications on this scale 10 valid of 10 ratio rows10 ratio rows retain source-reported units because no native exposure unit was stated | Association only; not tied to a schedule change |
| BrazilBRA | Meningococcalmeningococcal c primaryBrazil hospital disability outcome | Other reported outcomepositive control; vaccine-preventable disease | 1.004Median model estimateRange across compatible specifications: 0.978–1.035Source-reported RR (native exposure units not stated)16 specifications on this scale 16 valid of 16 ratio rows16 ratio rows retain source-reported units because no native exposure unit was stated | Association only; not tied to a schedule change |
| BrazilBRA | MMRMMR dose 1Brazil autism cohort | Autismautism | 0.997Median model estimateRange across compatible specifications: 0.990–1.000Source-reported RR (native exposure units not stated)9 specifications on this scale 9 valid of 9 ratio rows9 ratio rows retain source-reported units because no native exposure unit was stated | Association only; not tied to a schedule change |
| BrazilBRA | MMRMMR dose 1Brazil autism cohort | Other disability or health outcomeany disability | 1.002Median model estimateRange across compatible specifications: 0.999–1.009Source-reported RR (native exposure units not stated)3 specifications on this scale 3 valid of 3 ratio rows3 ratio rows retain source-reported units because no native exposure unit was stated | Association only; not tied to a schedule change |
The displayed number is the median point estimate across compatible specifications on the most common native scale in that family; when native scales tie, each tied scale is shown. The range is descriptive, not a confidence interval. These families contain 12,158 specification memberships. The download below contains all 25,559 project-wide statistical-result rows, including full specification-level intervals.
Sources
Where each policy, coverage, and autism measure came from
Finding a dataset does not make it a good causal test. This list records both the source and whether it was available for analysis.
…matching records
Loading the source register…
Paper and data
Read the paper or examine the evidence
The paper presents the findings; the supplement explains the models, checks and sensitivities. Result tables preserve each estimate’s units and limitations. Multiple rows can describe the same underlying data.
Results overviewPrincipal findings, uncertainty and sensitivity tablesComplete results tables24 CSV tables, effect scales and numerical source bindingsManuscriptPDF · research paper, 28 October 2026Robustness supplementPDF · methods, diagnostics and sensitivity analyses, 28 October 2026Reproduce the main resultSources with links and fingerprints, code, rules and stepsCore estimatesCSV · effect sizes and intervalsComparison-specific estimatesCSV · 14 analyses, uncertainty, power, and design checksSchedule-change inventory with estimatesCSV · 3,422 records and 3,391 linked episodesAnalytical event ledgerCSV · 3,379 event recordsEvidence registerCSV · 737 provenance recordsCombined result registerCompressed CSV · 72,585 analysis records with source provenanceSynthesis-family estimatesCSV · current summaries on their distinct effect scalesAdditional native-scale estimates and diagnosticsCSV · 2,067 records, including regional disability associations, with original units and overlap notesSource-to-analysis accountingCSV · roles for all 143 distinct held candidate tables; exclusion from pooling is not a null resultResult-register workbookAdministrative-subset estimates, historical register and source hashesChecked design inventoryAll 206 jump, interaction and synthetic-control recordsCountry-level analysis indexCSV · 1099 analysis families from 66 datasetsHarmonized statistical-results ledgerCSV · 25,559 archived model rows; recent chronic analyses are listed separately aboveReproduction guideMarkdown · acquisition rules and one-command entry pointsPortable synthesis replayVerified ZIP download · code, inputs and results · saved-likelihood, native-family and cohort-diagnostic replayReplay instructions and scopeTested commands, source acquisition, and excluded raw-source stepsSource catalogCSV · 400 dated source recordsAnalysis catalogCSV · scripts, inputs, and outputsRelease manifestFile hashes linking the current PDFs, synthesis and complete registerReproduction scopeWhat the supplied code and frozen inputs reproduce
Audit records and historical calculations
These files document provenance and validation. Calculations marked invalid or superseded are not used as evidence of vaccine harm or safety.
Archived probability calculationsCSV · stipulated mappings; PCV7-containing probabilities do not quantify vaccine harmHistorical reproducibility checksCSV · contract ledger, not certification of the current full packageArchived calibration calculationsCSV with a status column: the PCV7 coefficient-to-risk mapping is withdrawn (failed validation); no row is an individual-risk boundArchived calibration chartSVG · invalidated PCV7 risk mapping, not current evidence about individual harmScientific scope and limitationsScope, verified modules and unresolved scientific questionsUnit conventions and source mappingsJSON · every line where a download differs from its canonical source, and why
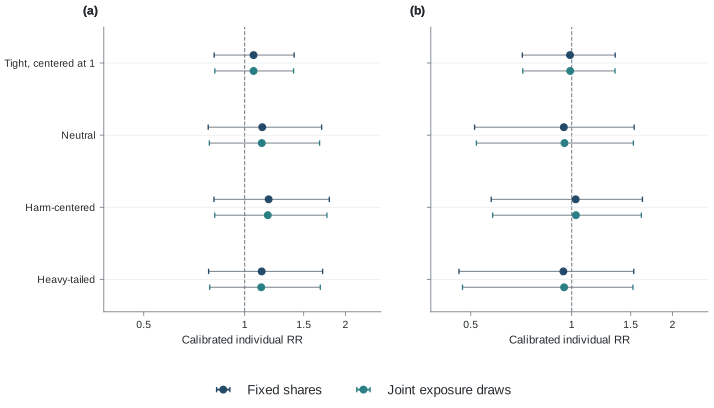
Analysis files
Detailed reports and figures
Download the tables, methods and figures for each analysis. The file manifest records checksums for verifying the downloads.
Empirically calibrated synthesisSummative estimate with bias allowances measured by the negative controls
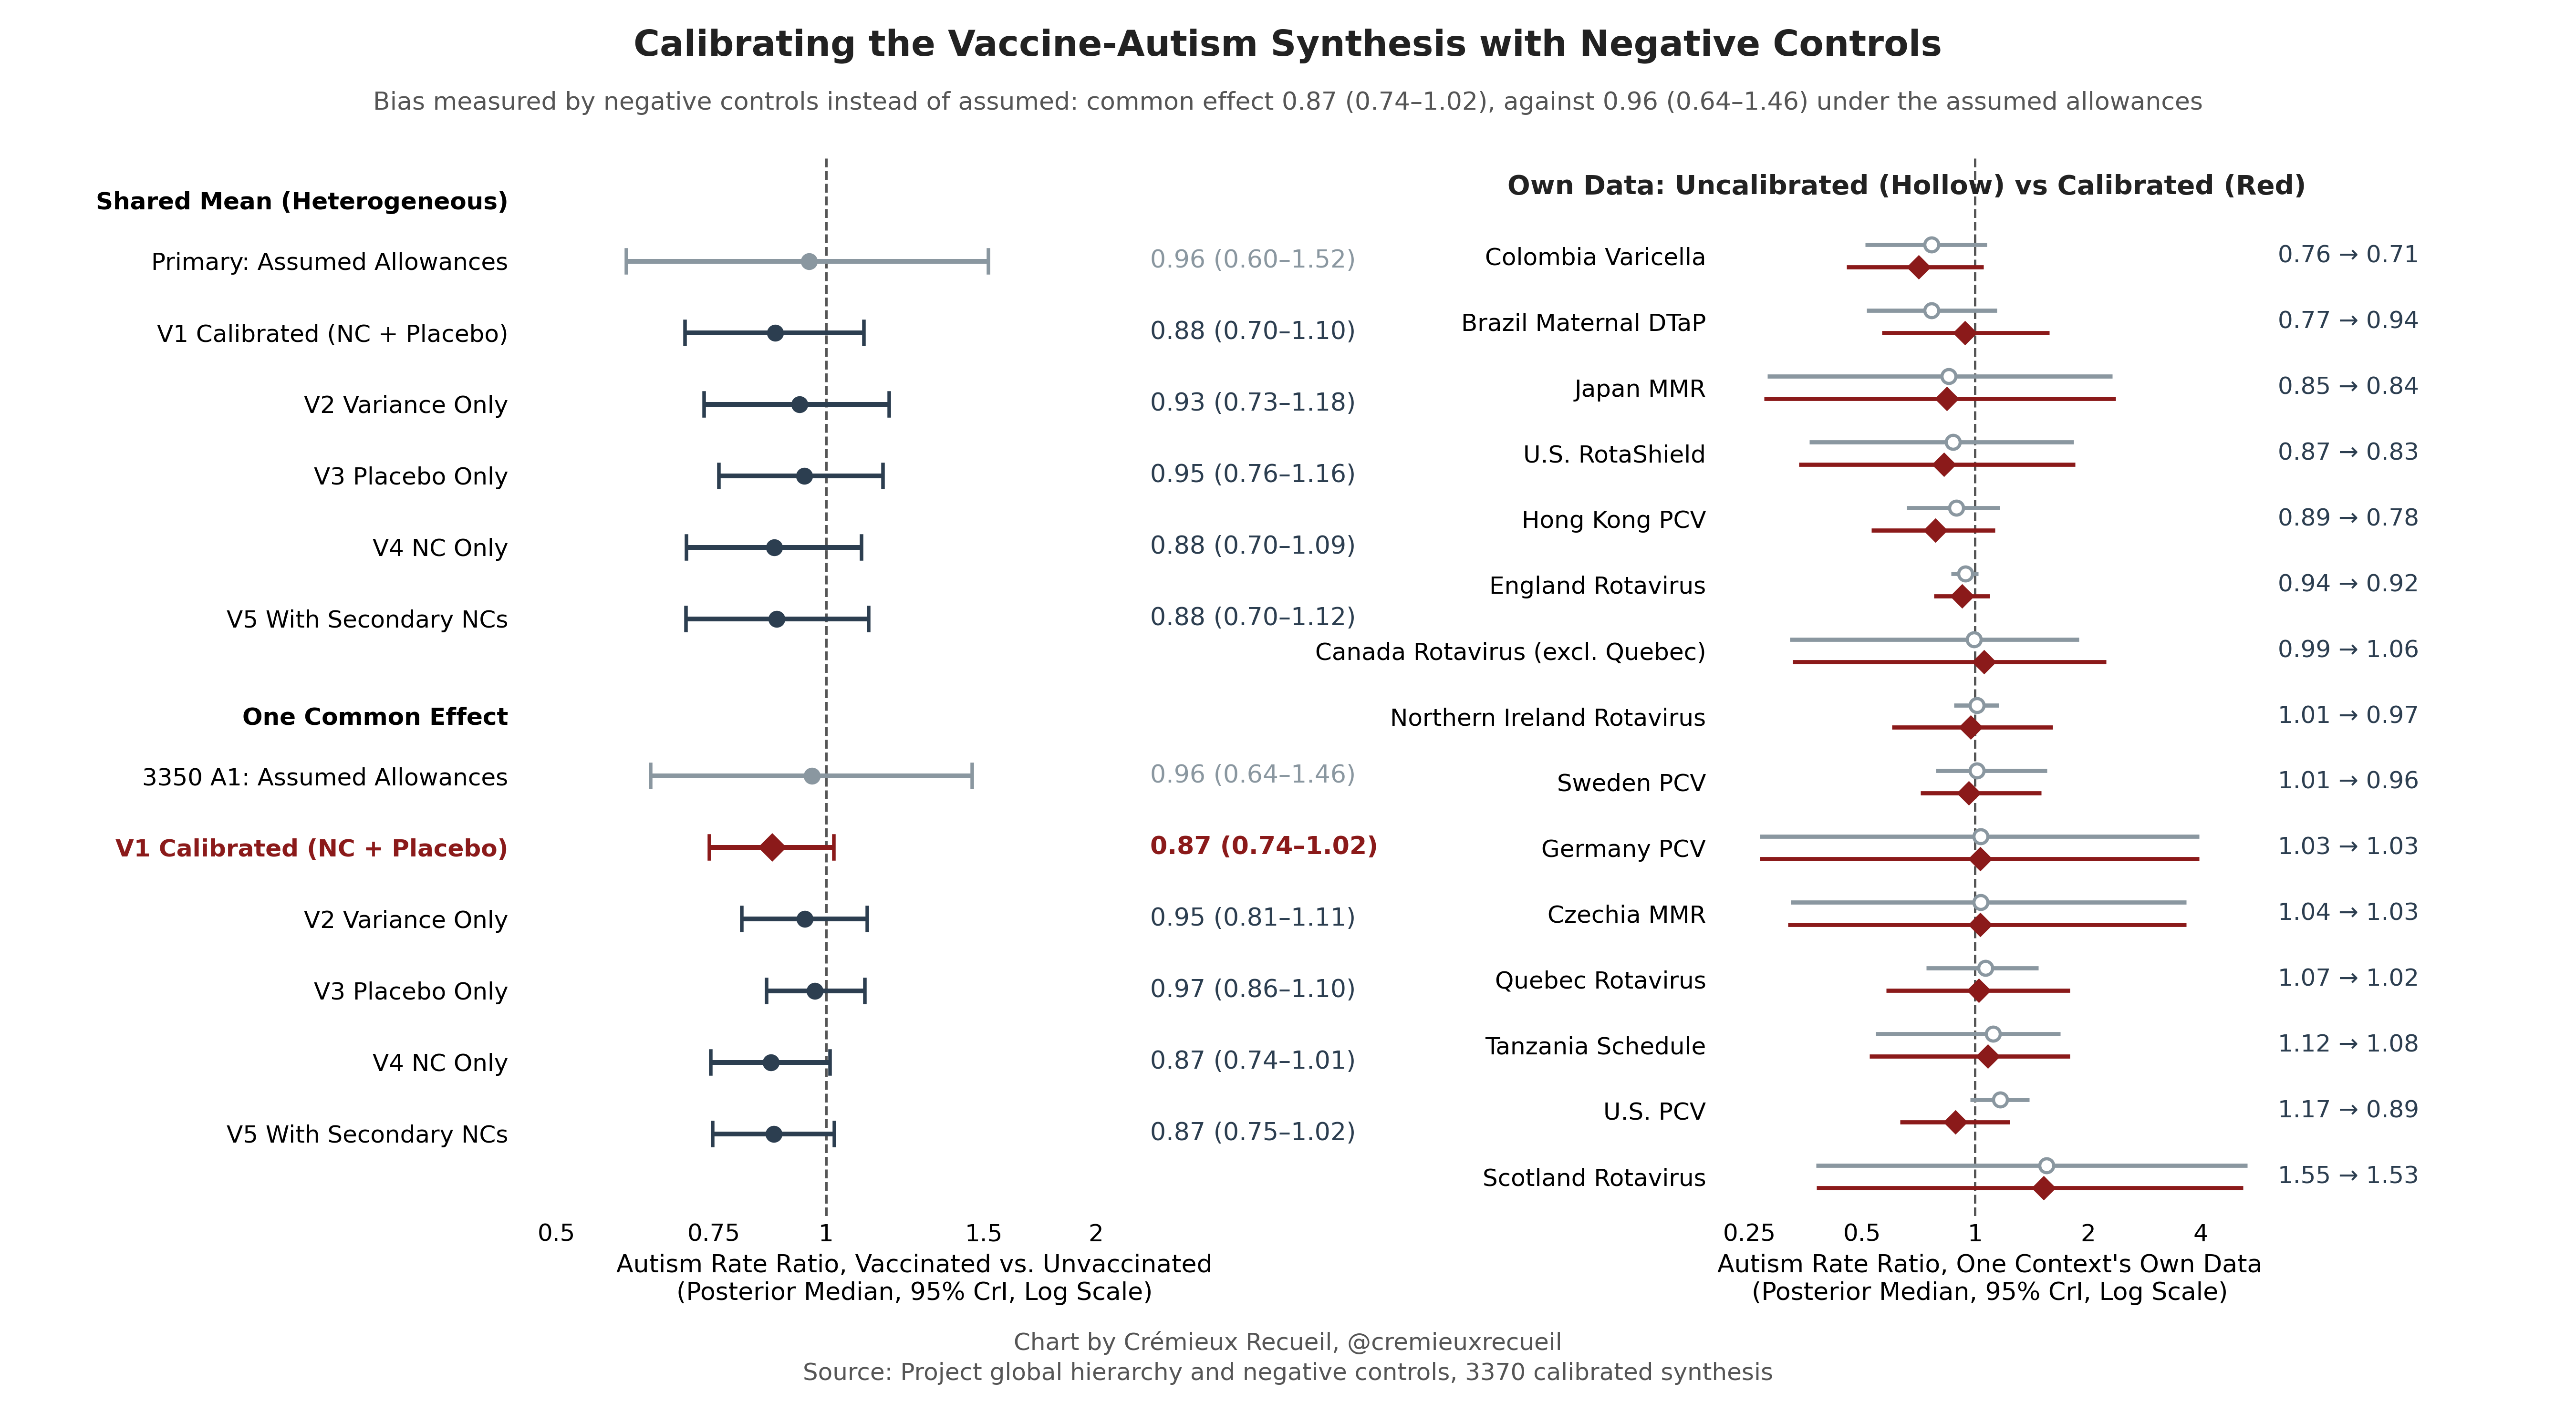
Posterior probabilities of harm, null and benefitBenefit (RR below 0.95), practical null (0.95-1.05) and harm (above 1.05) for four estimands, with the point-null Bayes factors
Generalized-claim testsOne common effect, one effect per vaccine, and whether every context is harmed
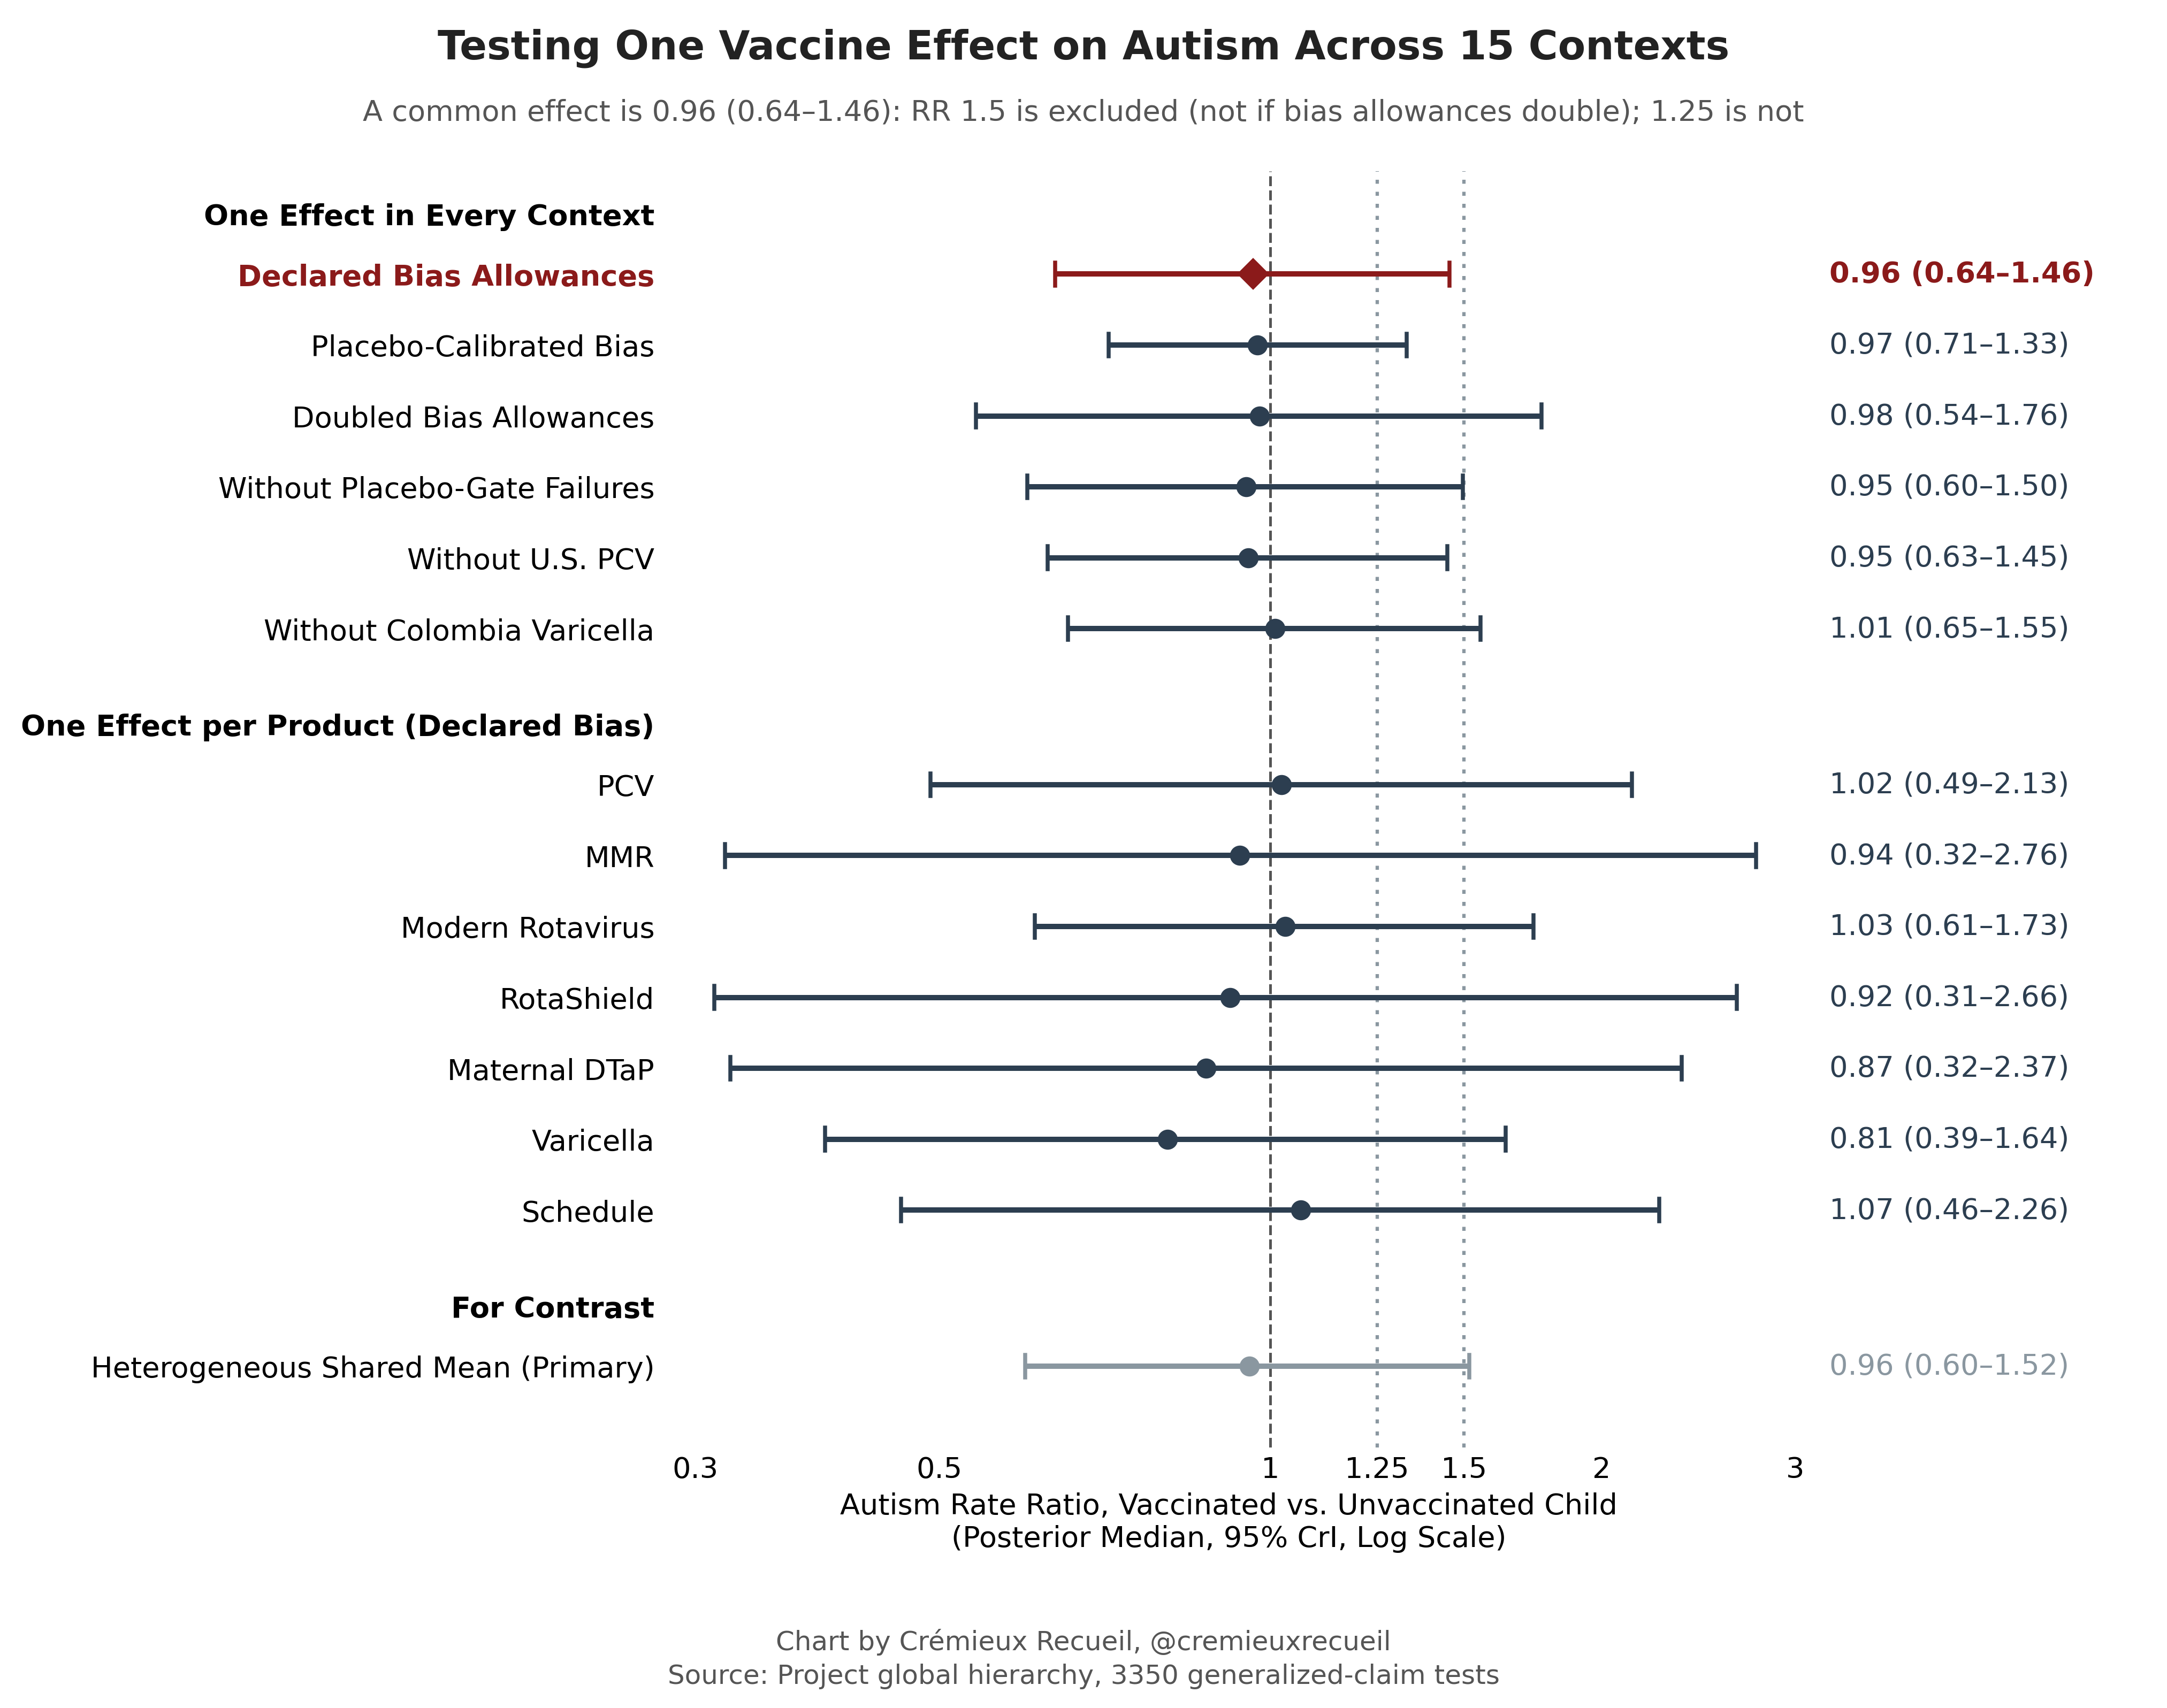
Bias-signal contexts and shared-bias SDU.S. PCV, Brazil and Hong Kong dropped jointly, and the shared-bias allowance varied from 0 to 0.30
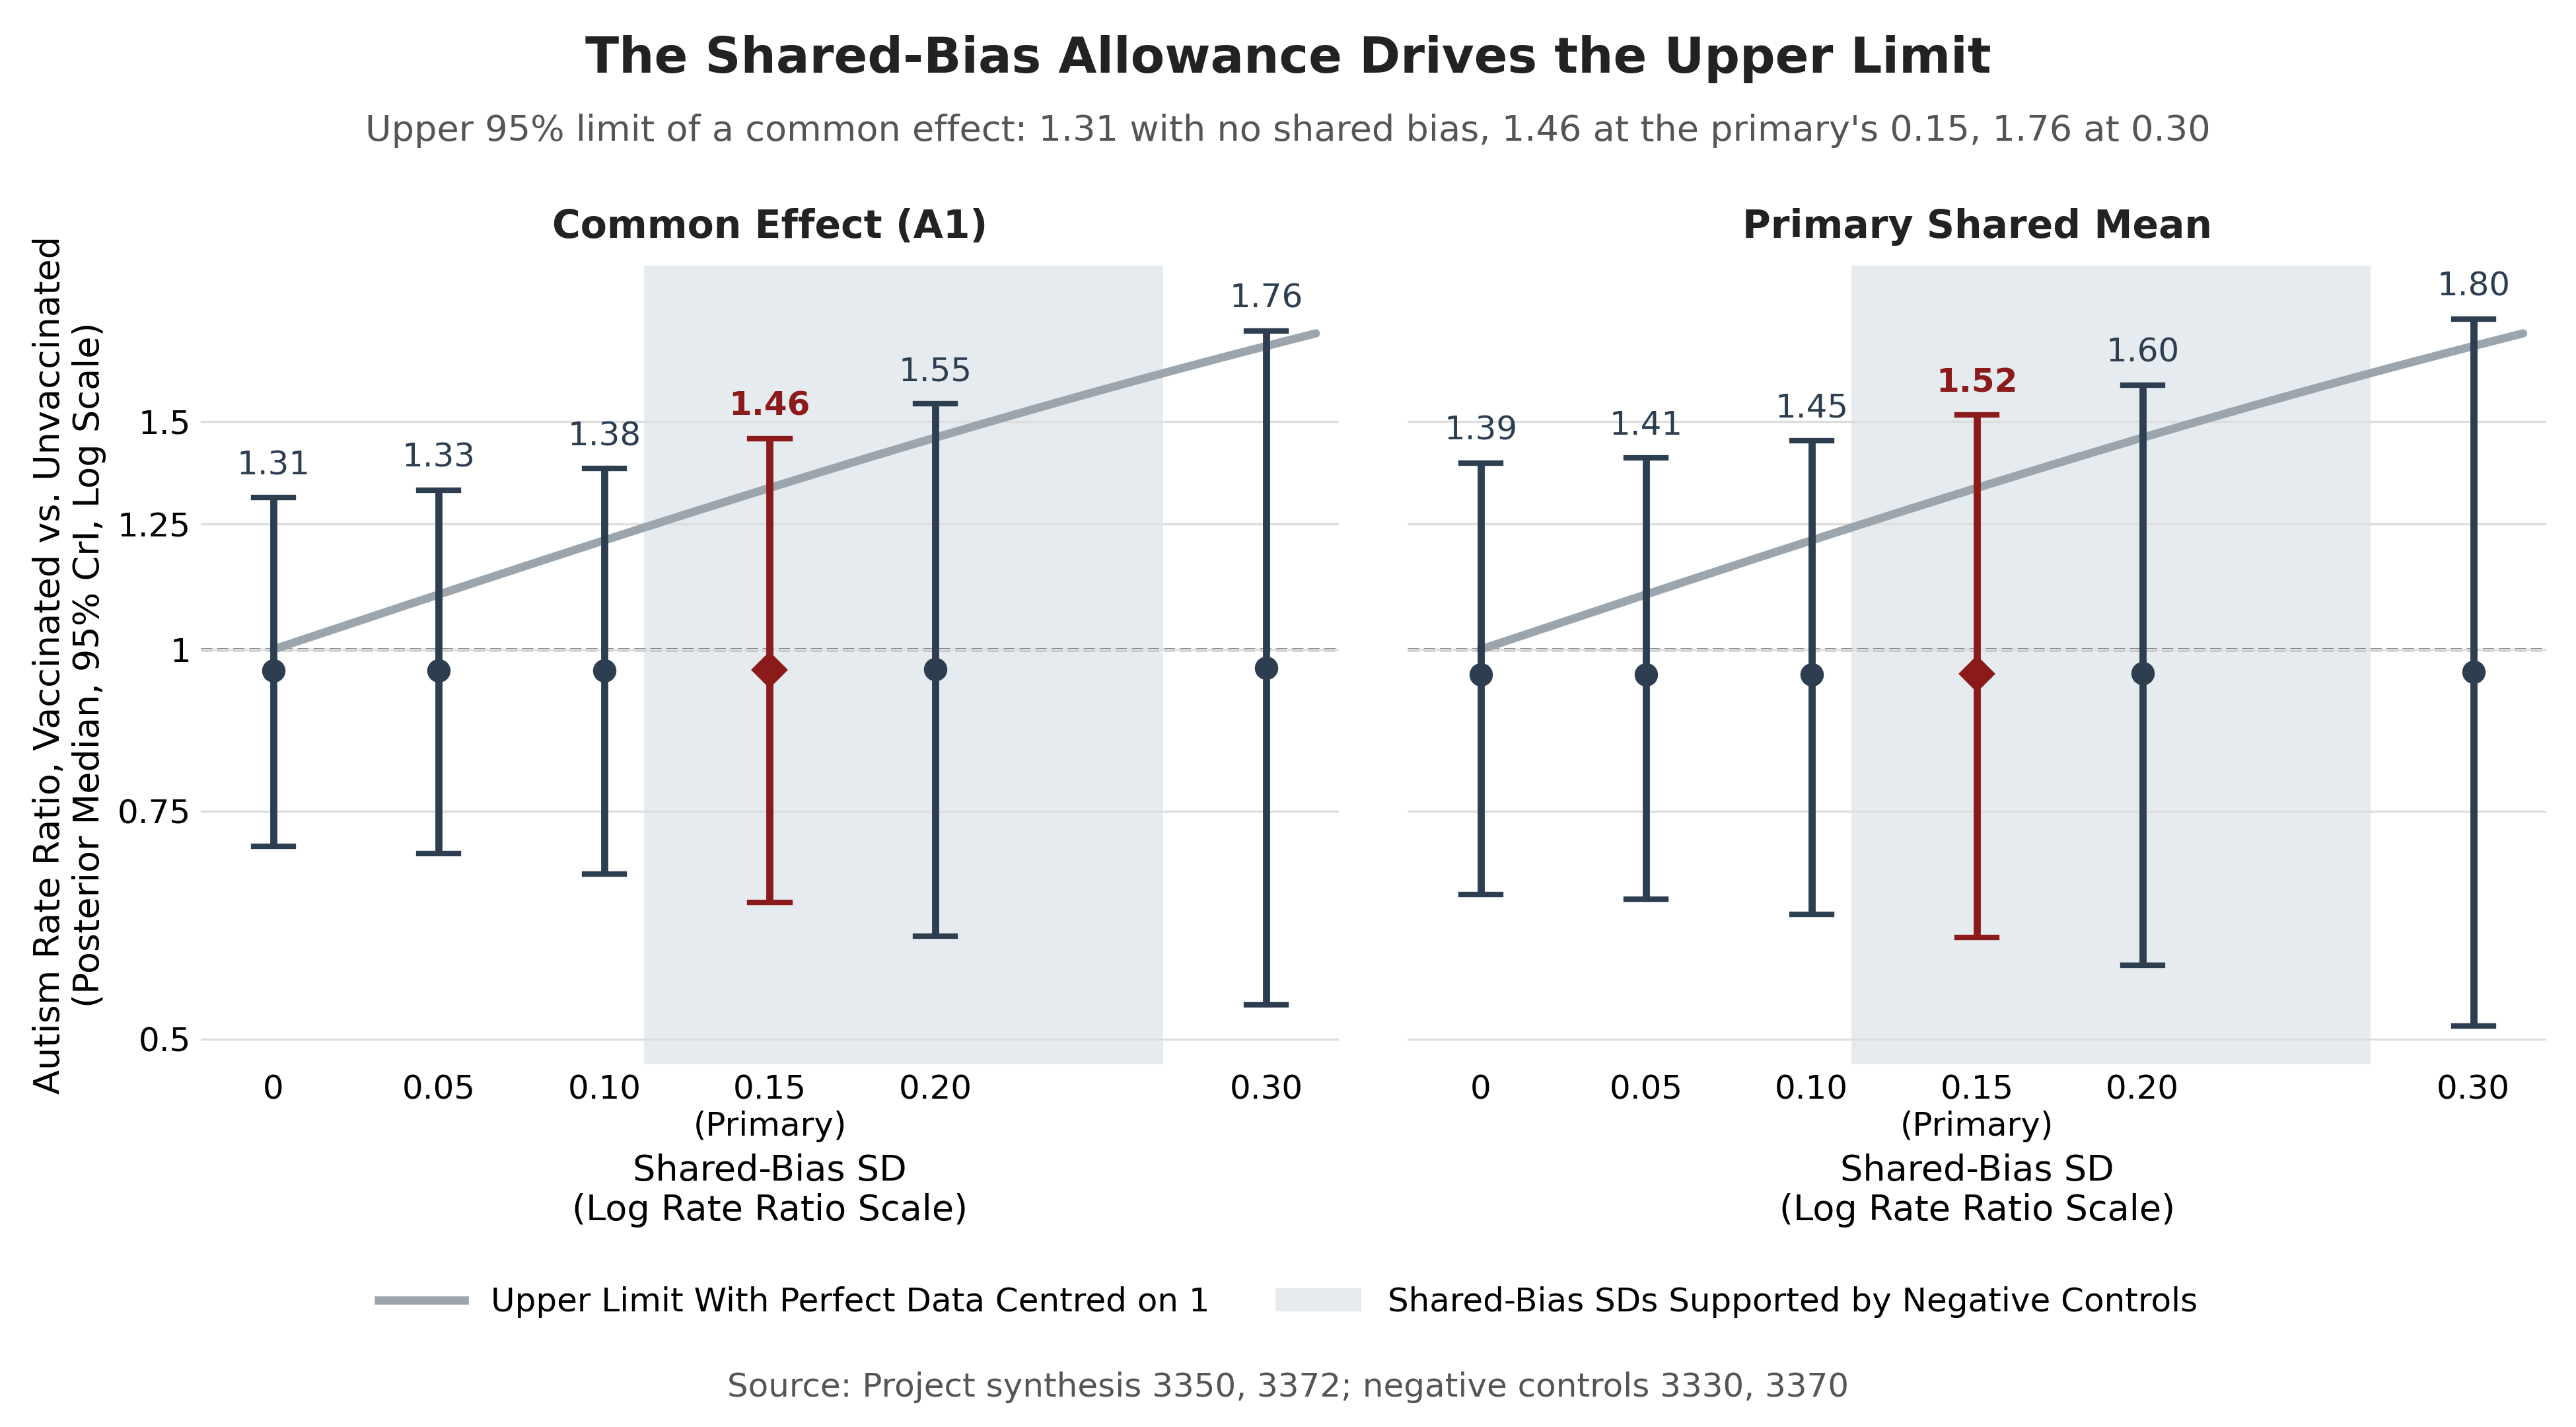
Colombia pandemic-years sensitivityThe synthesis with Colombia's 2020-2021 school years dropped or treated as a nuisance
Observed versus simulated synthesisThe observed shared mean against simulated worlds with and without a common harm
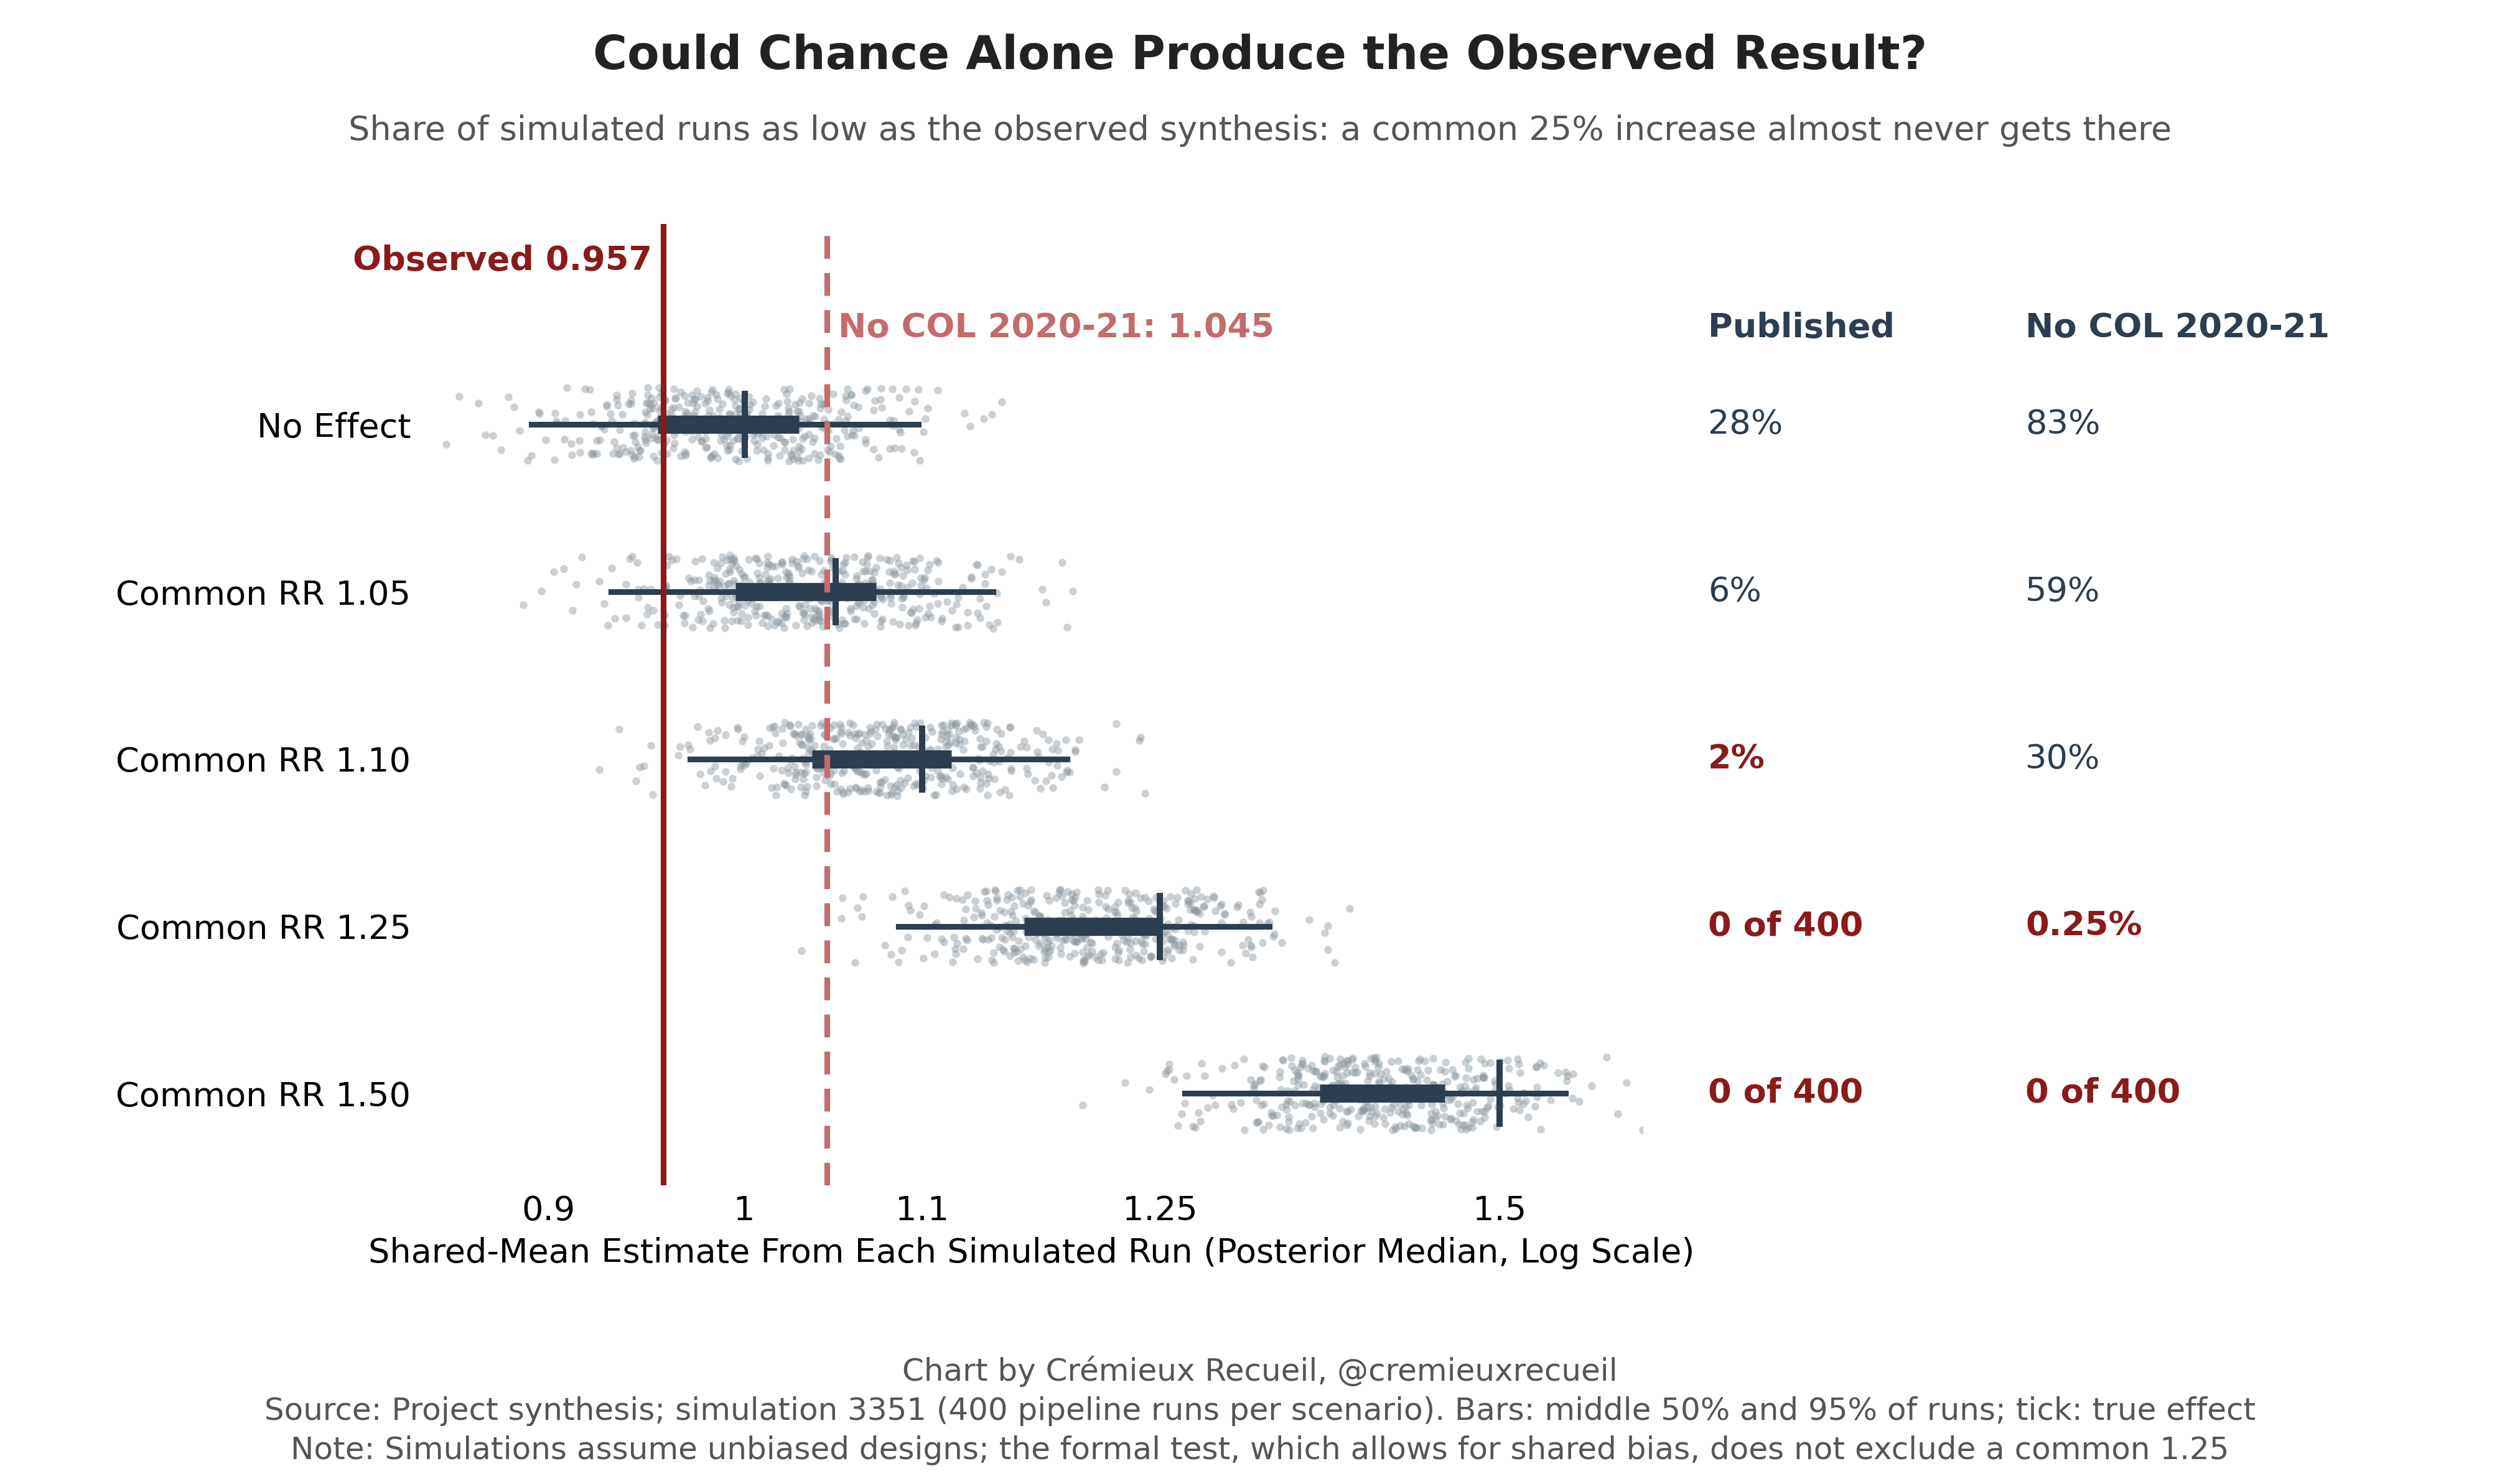
Whole-pipeline power and calibrationDetection, exclusion and coverage when harm is simulated into the real data structure
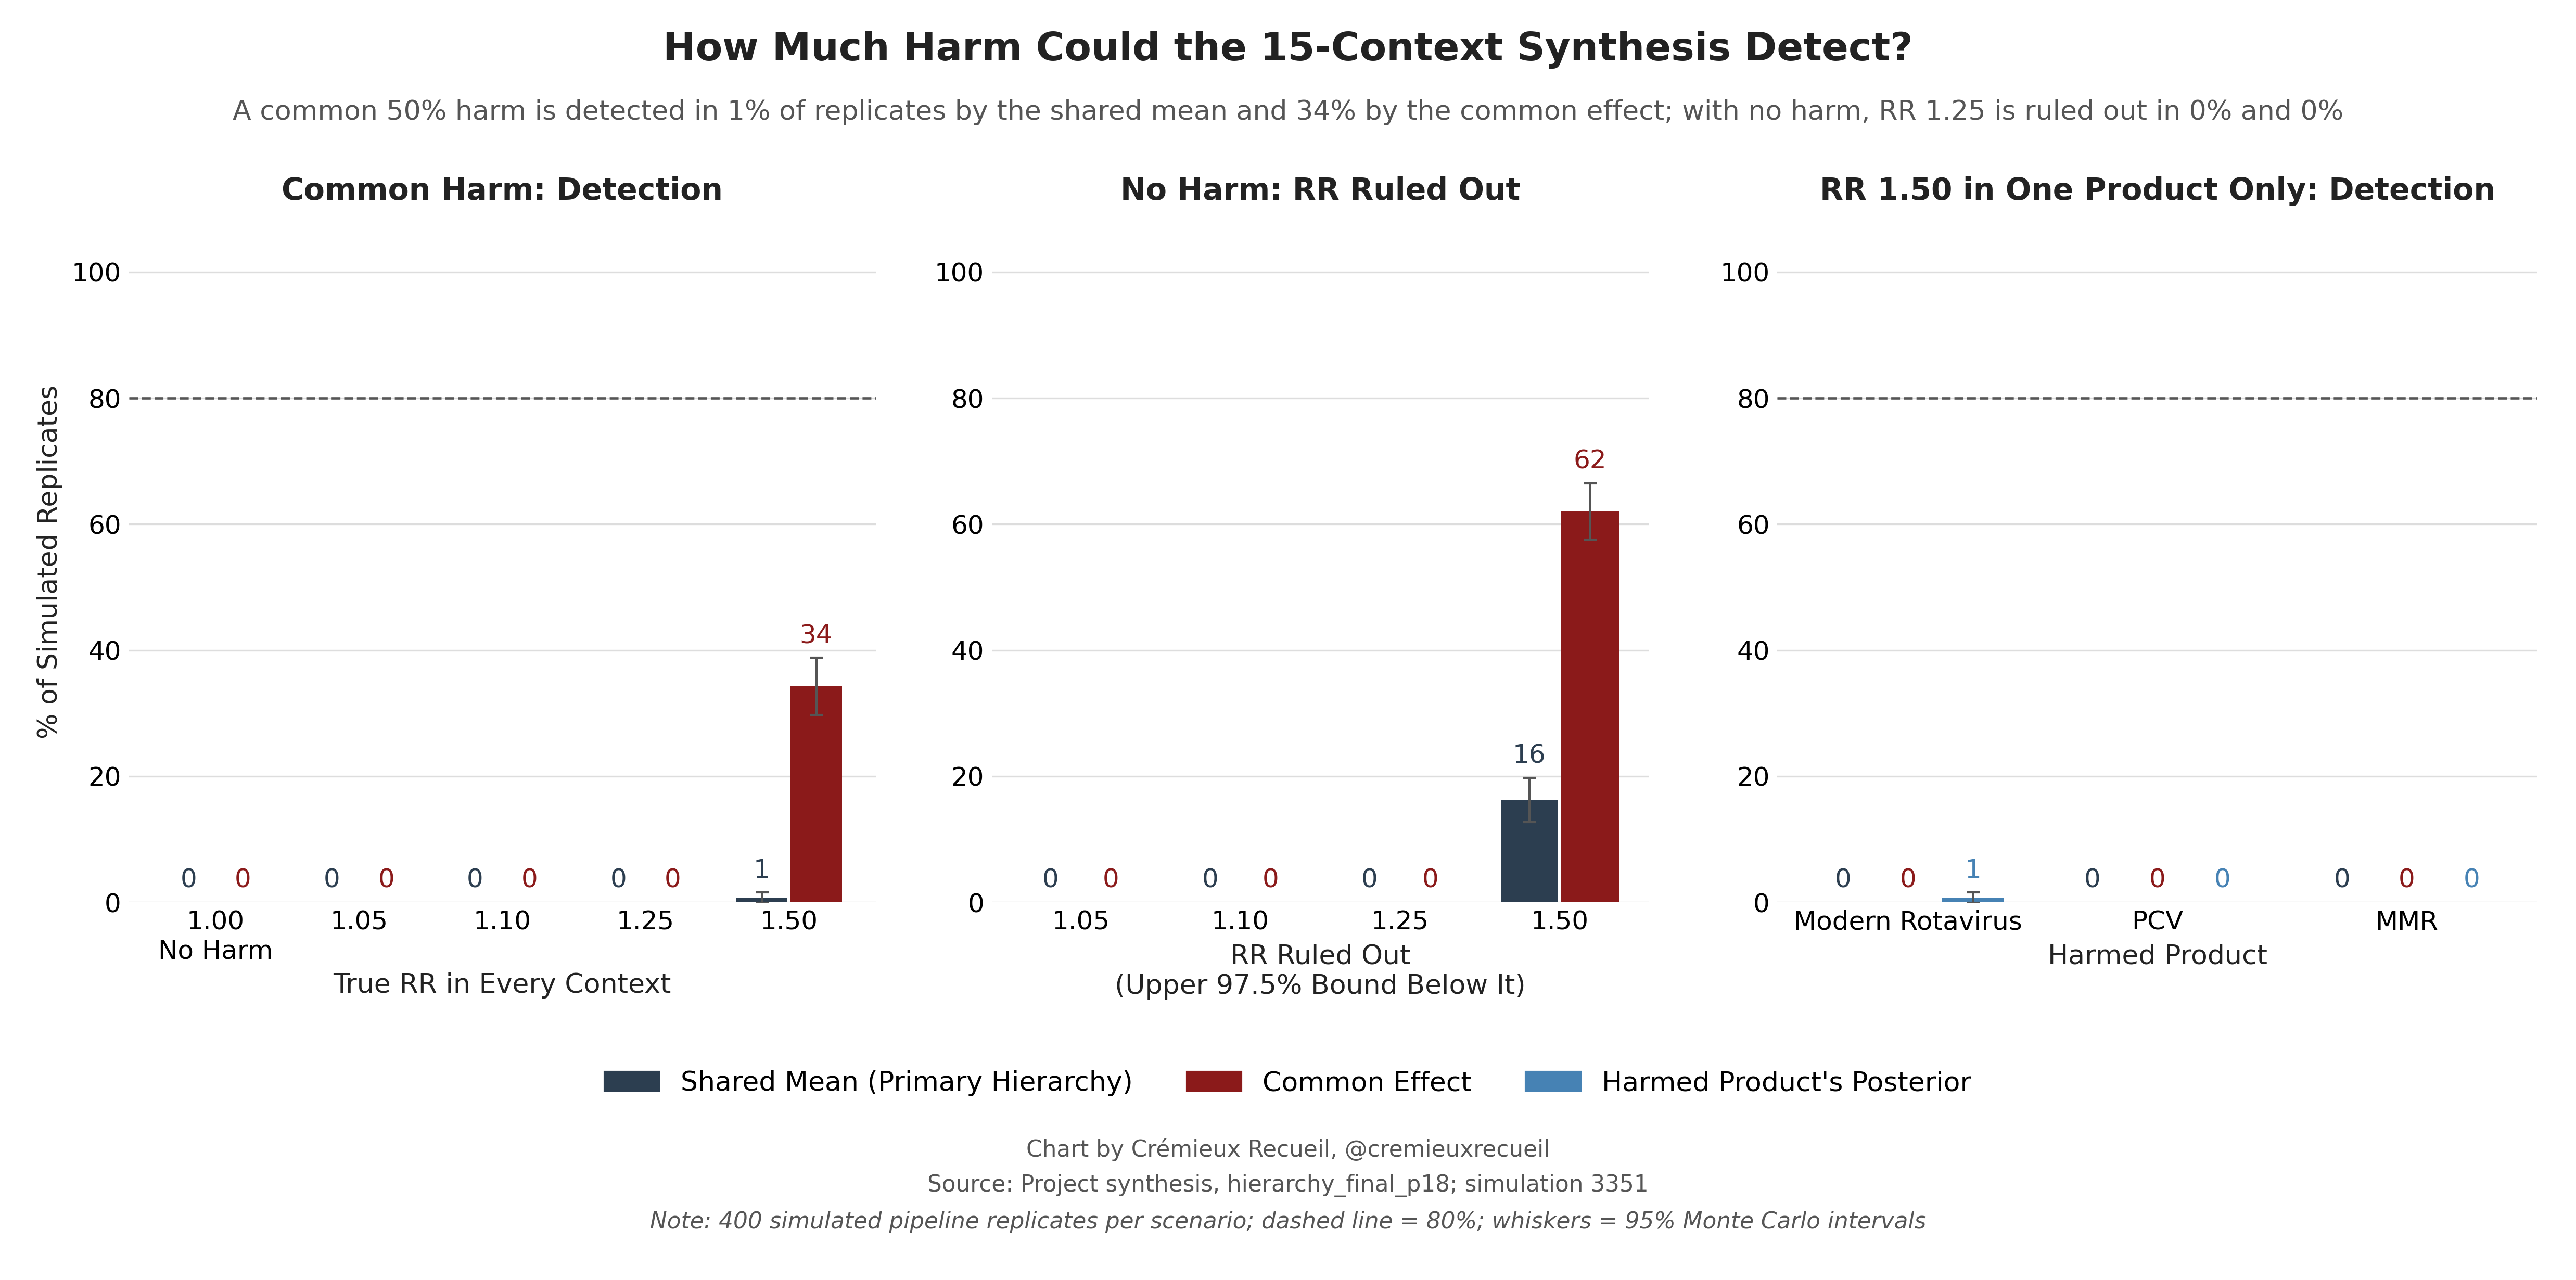
Negative-control summary chartEach context's autism estimate above its negative controls (Substack chart 7)
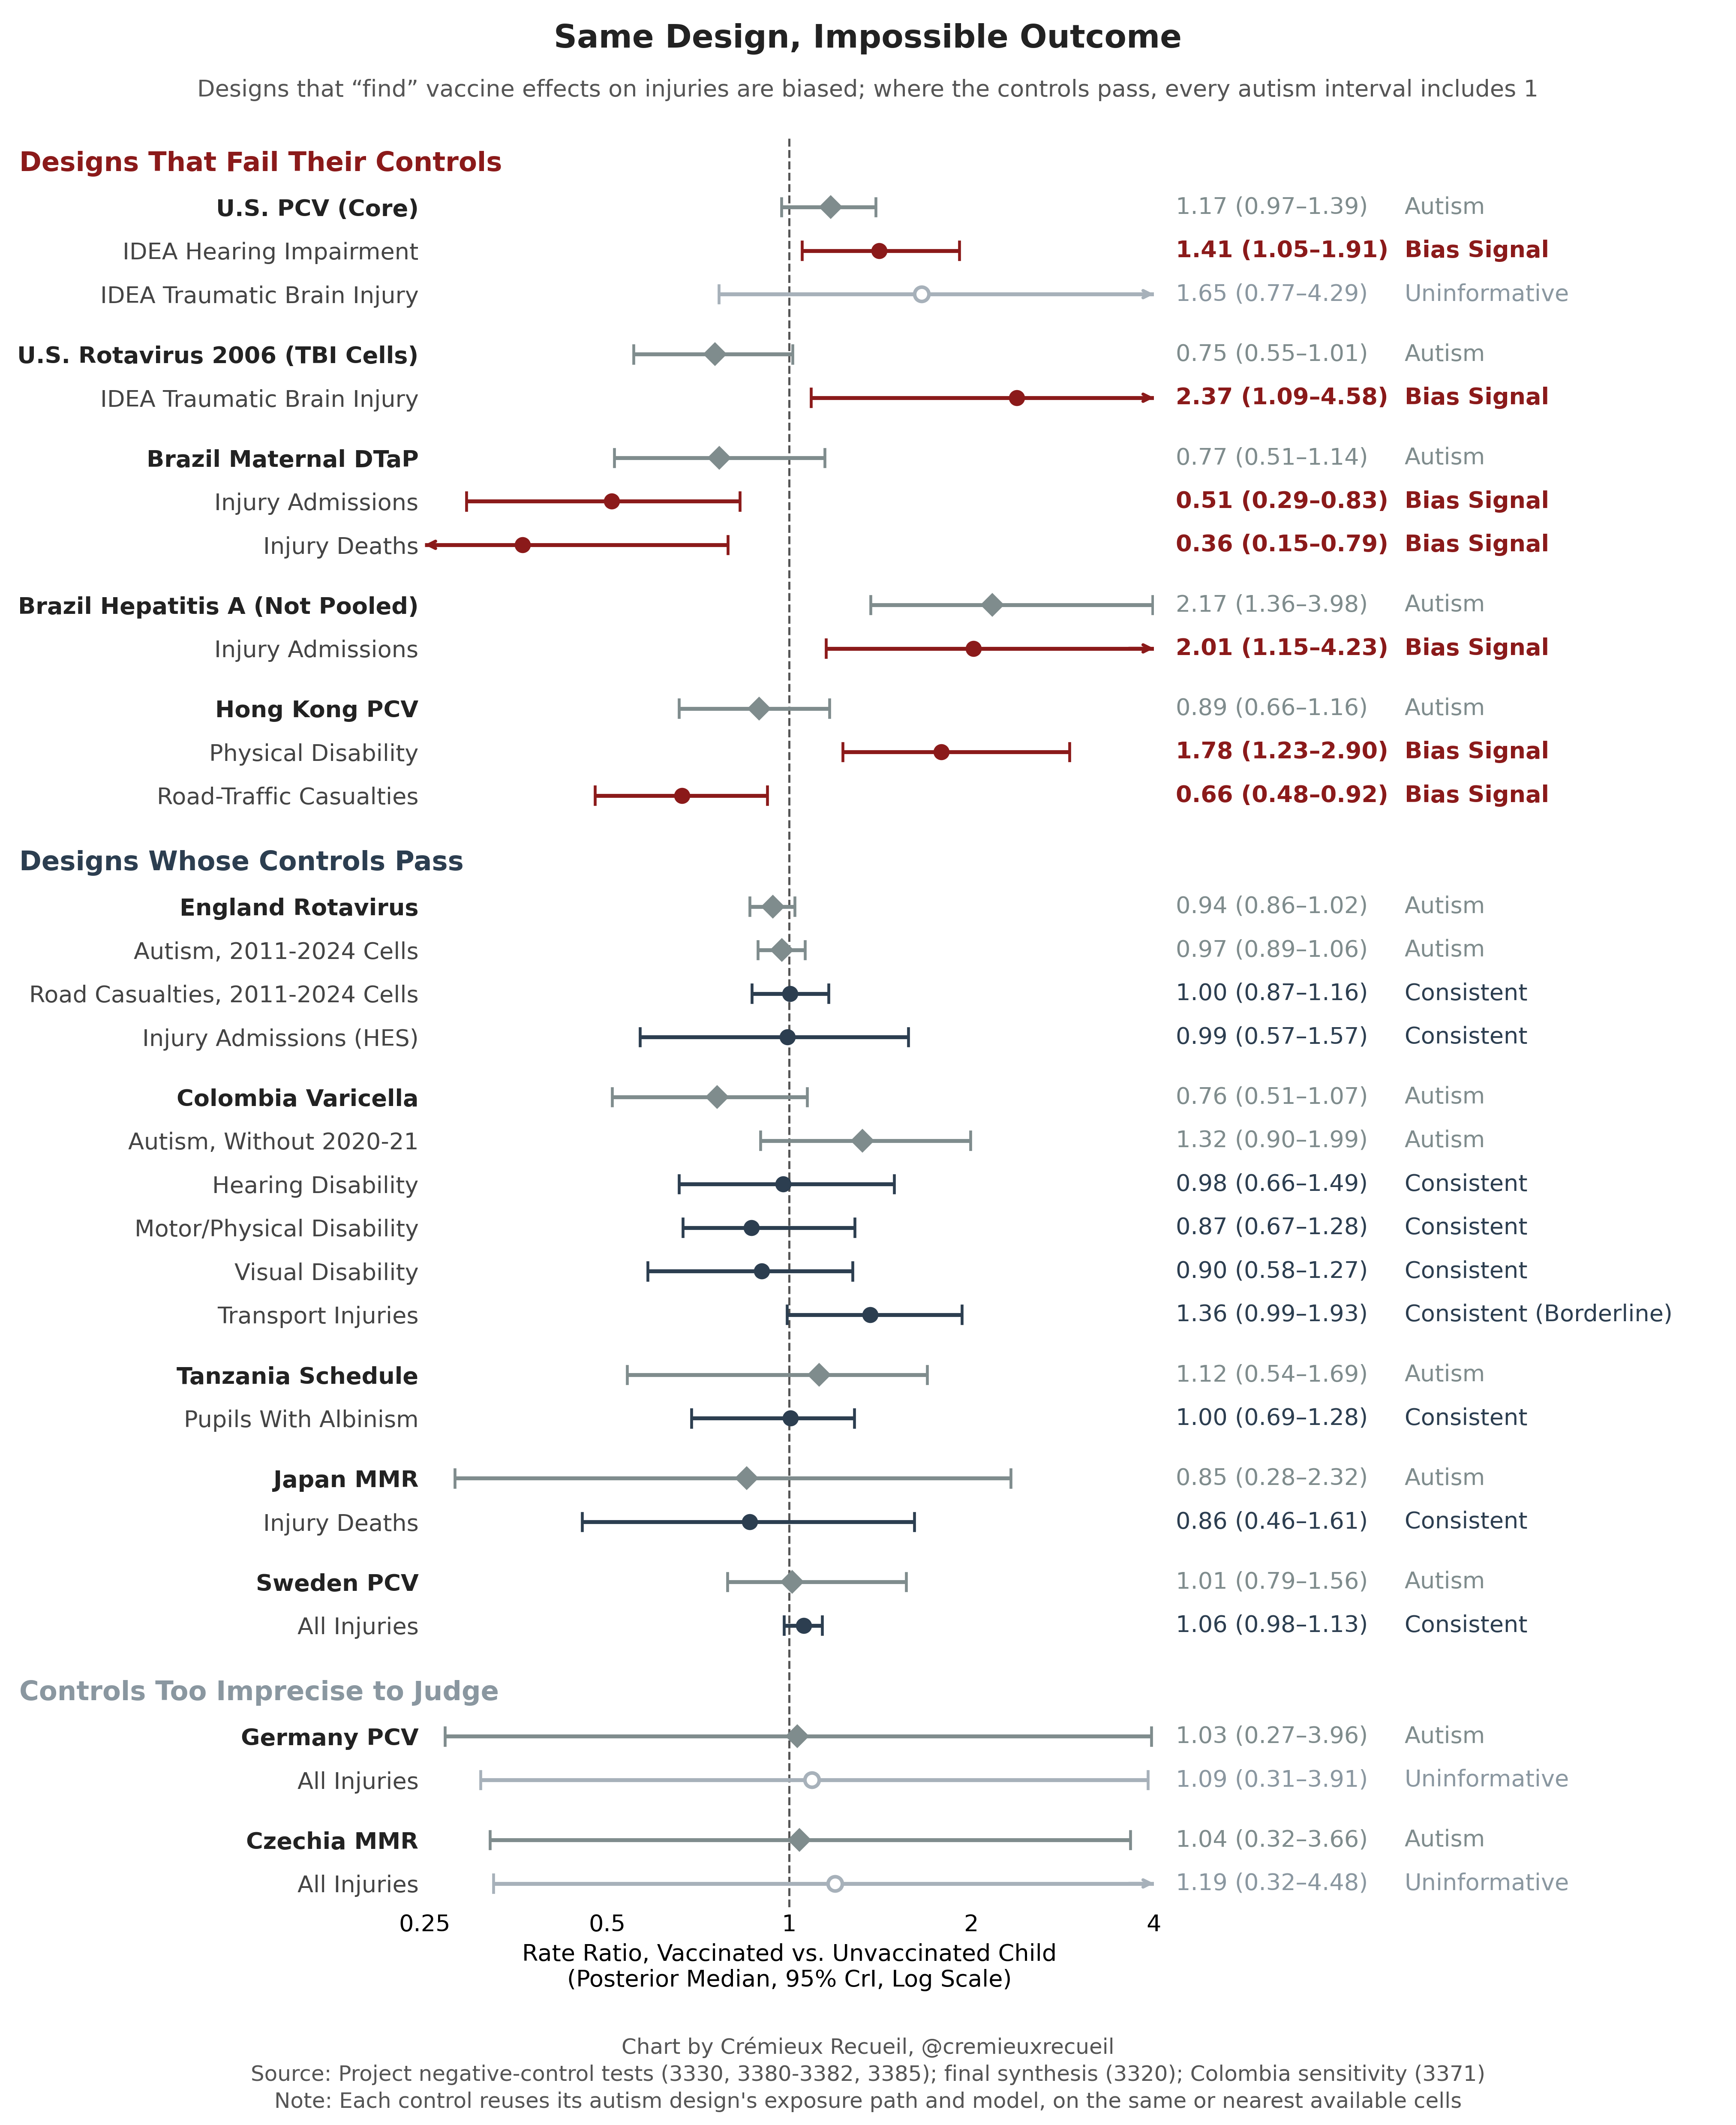
Negative controls, round 1Rows from 19 source analyses with one uniform class
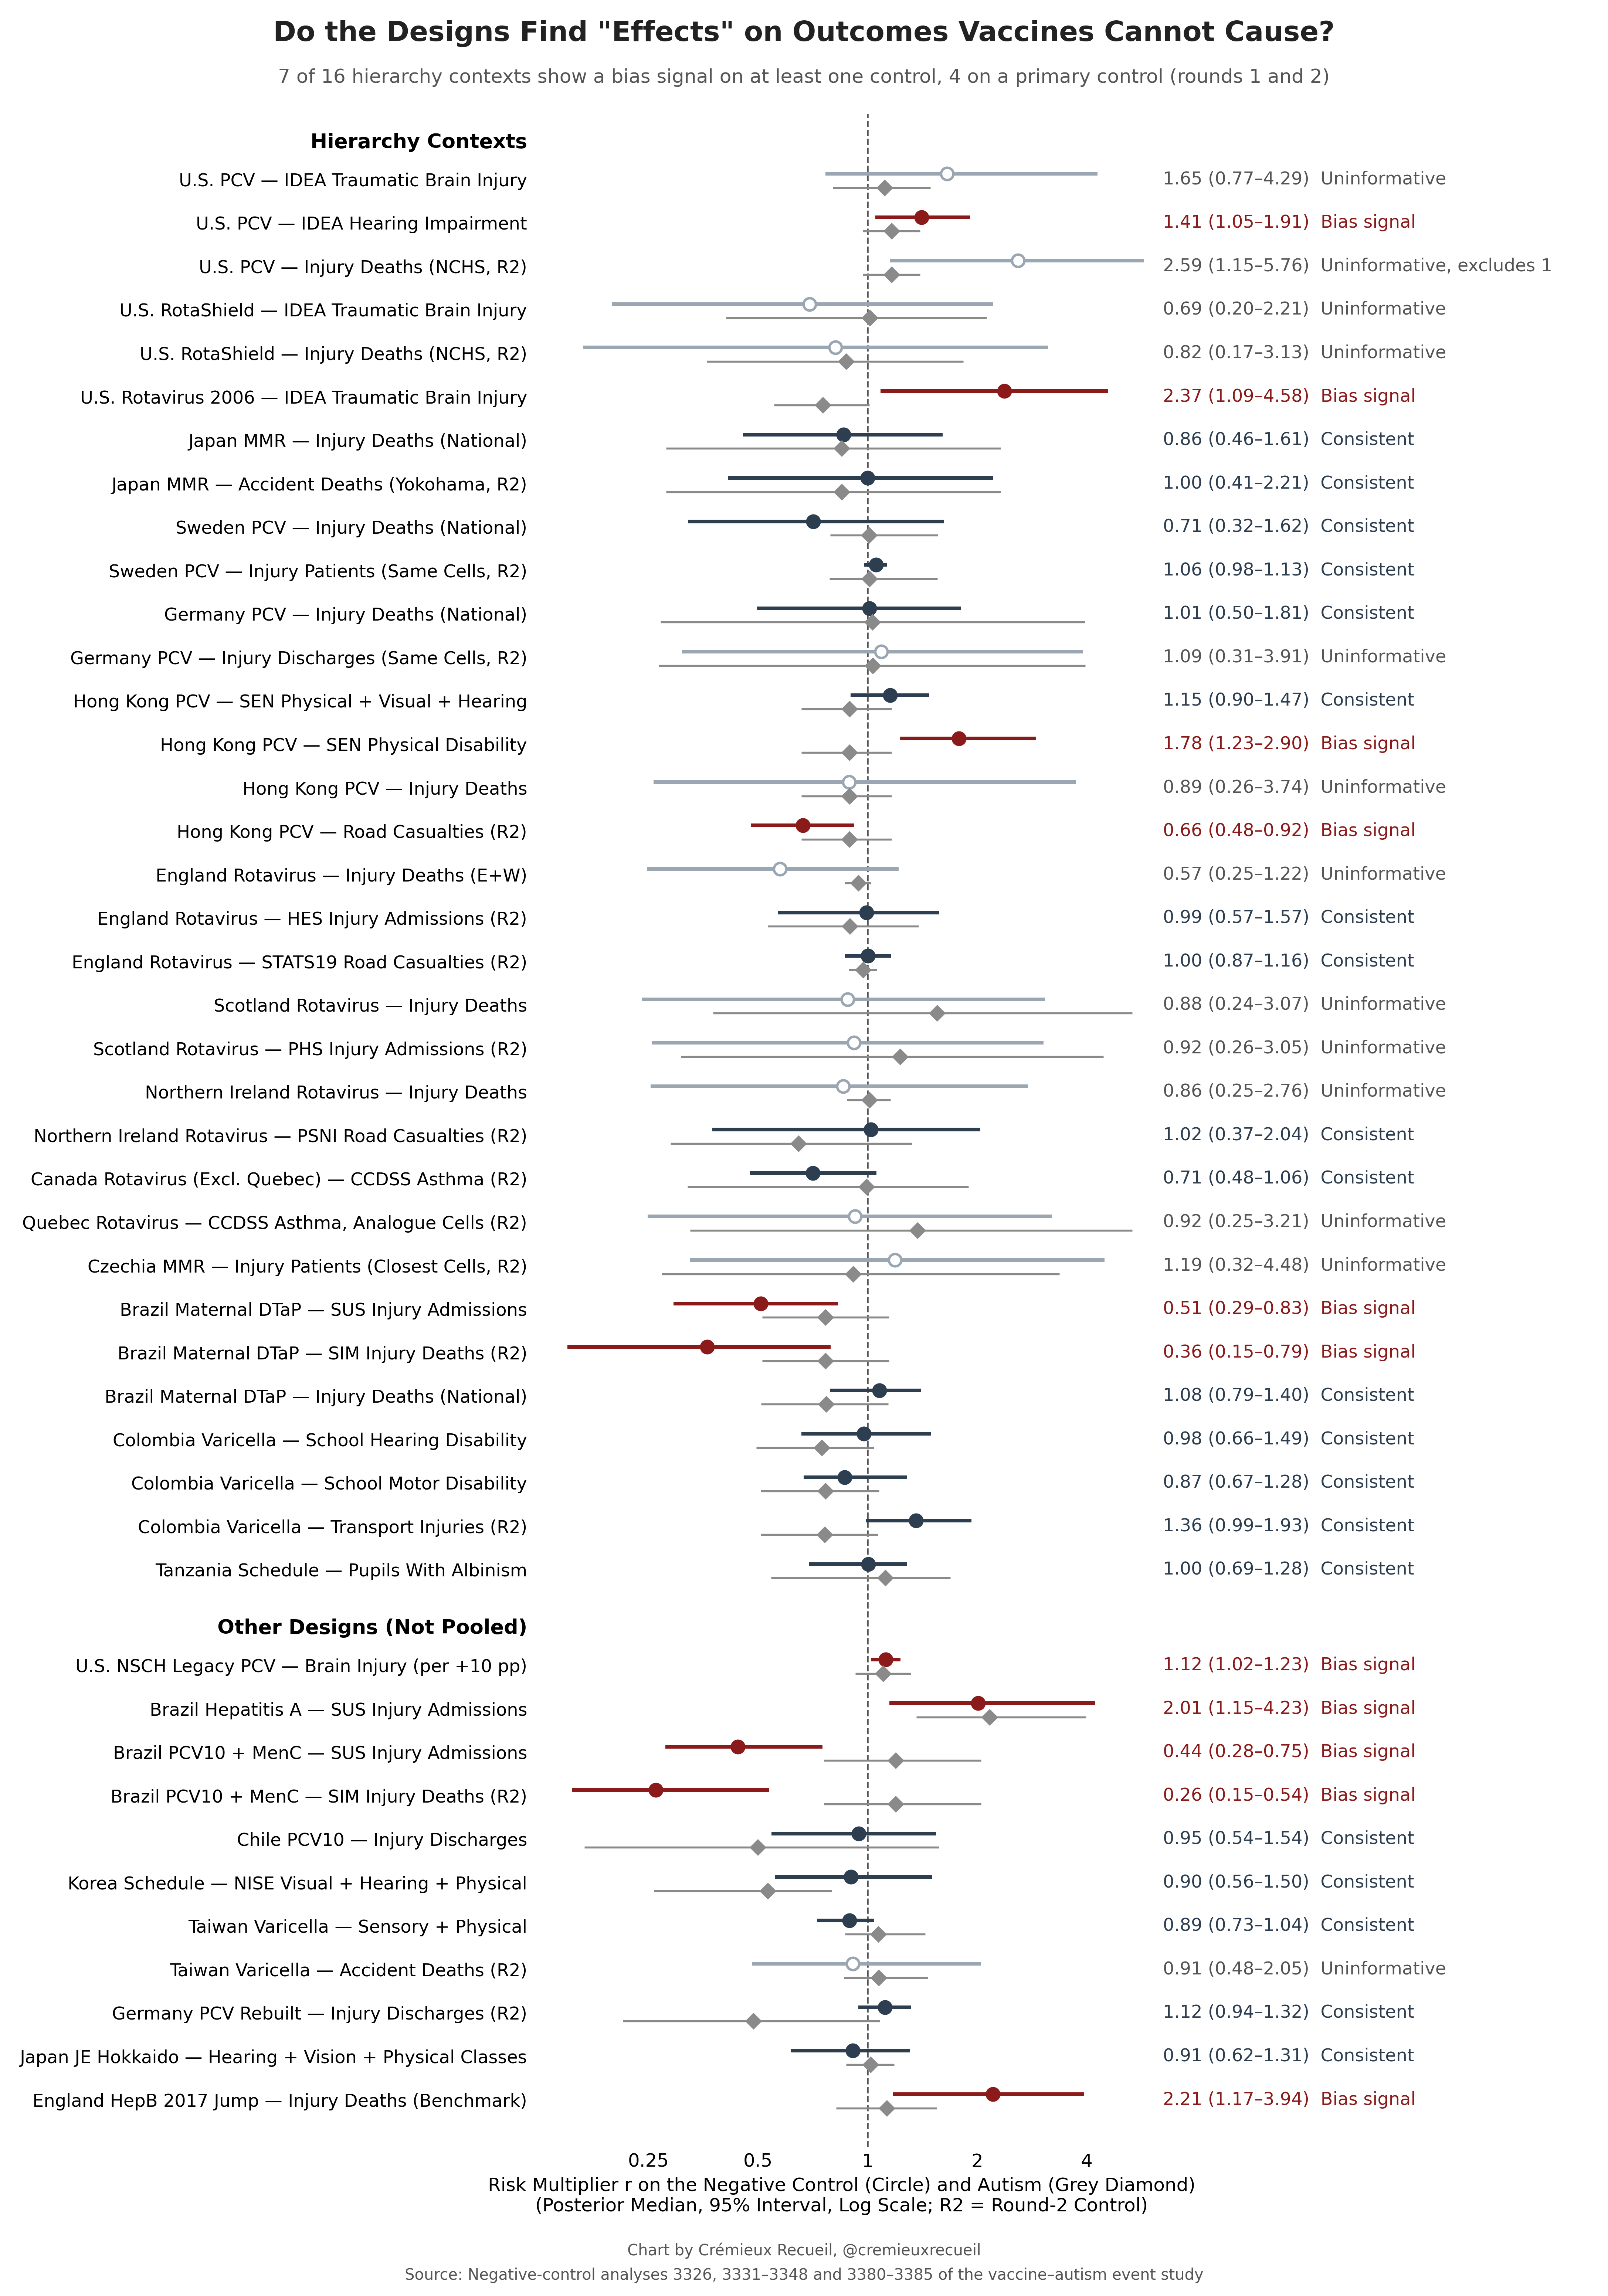
U.S. core negative controlsIDEA hearing, orthopedic and visual categories on the core cells
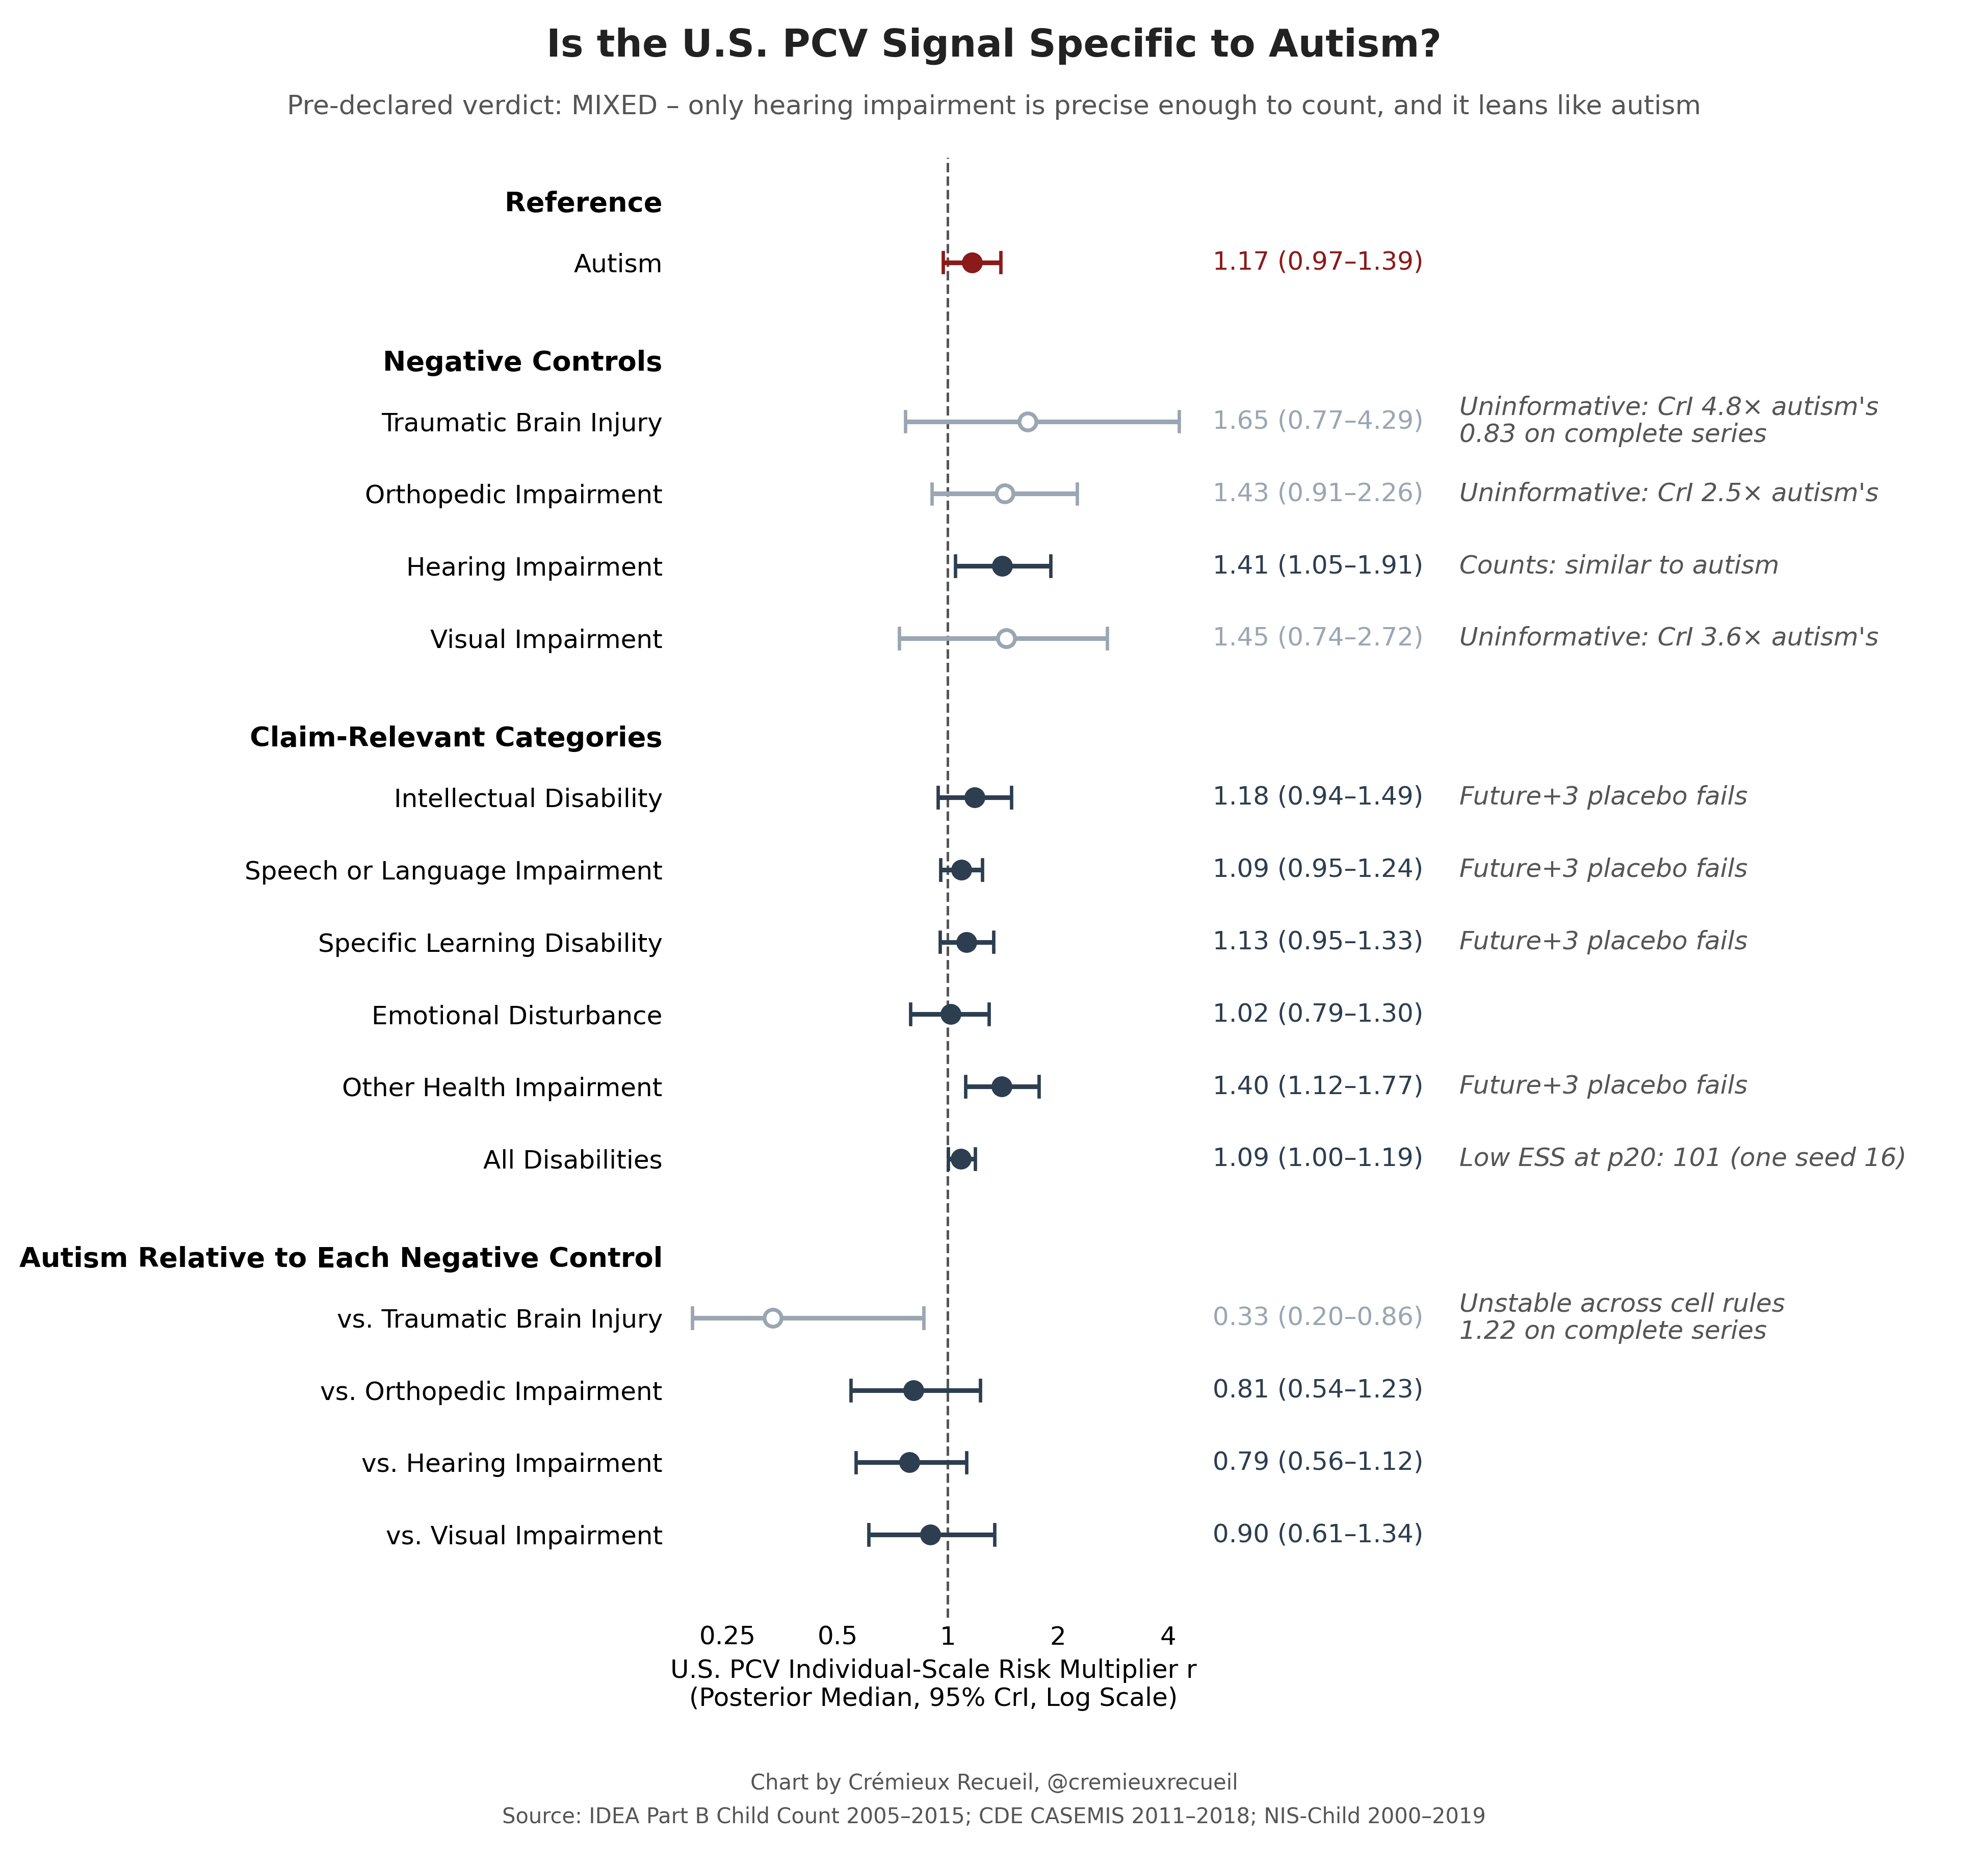
UK injury controls, round 2Hospital admissions and road casualties on the UK rotavirus designs
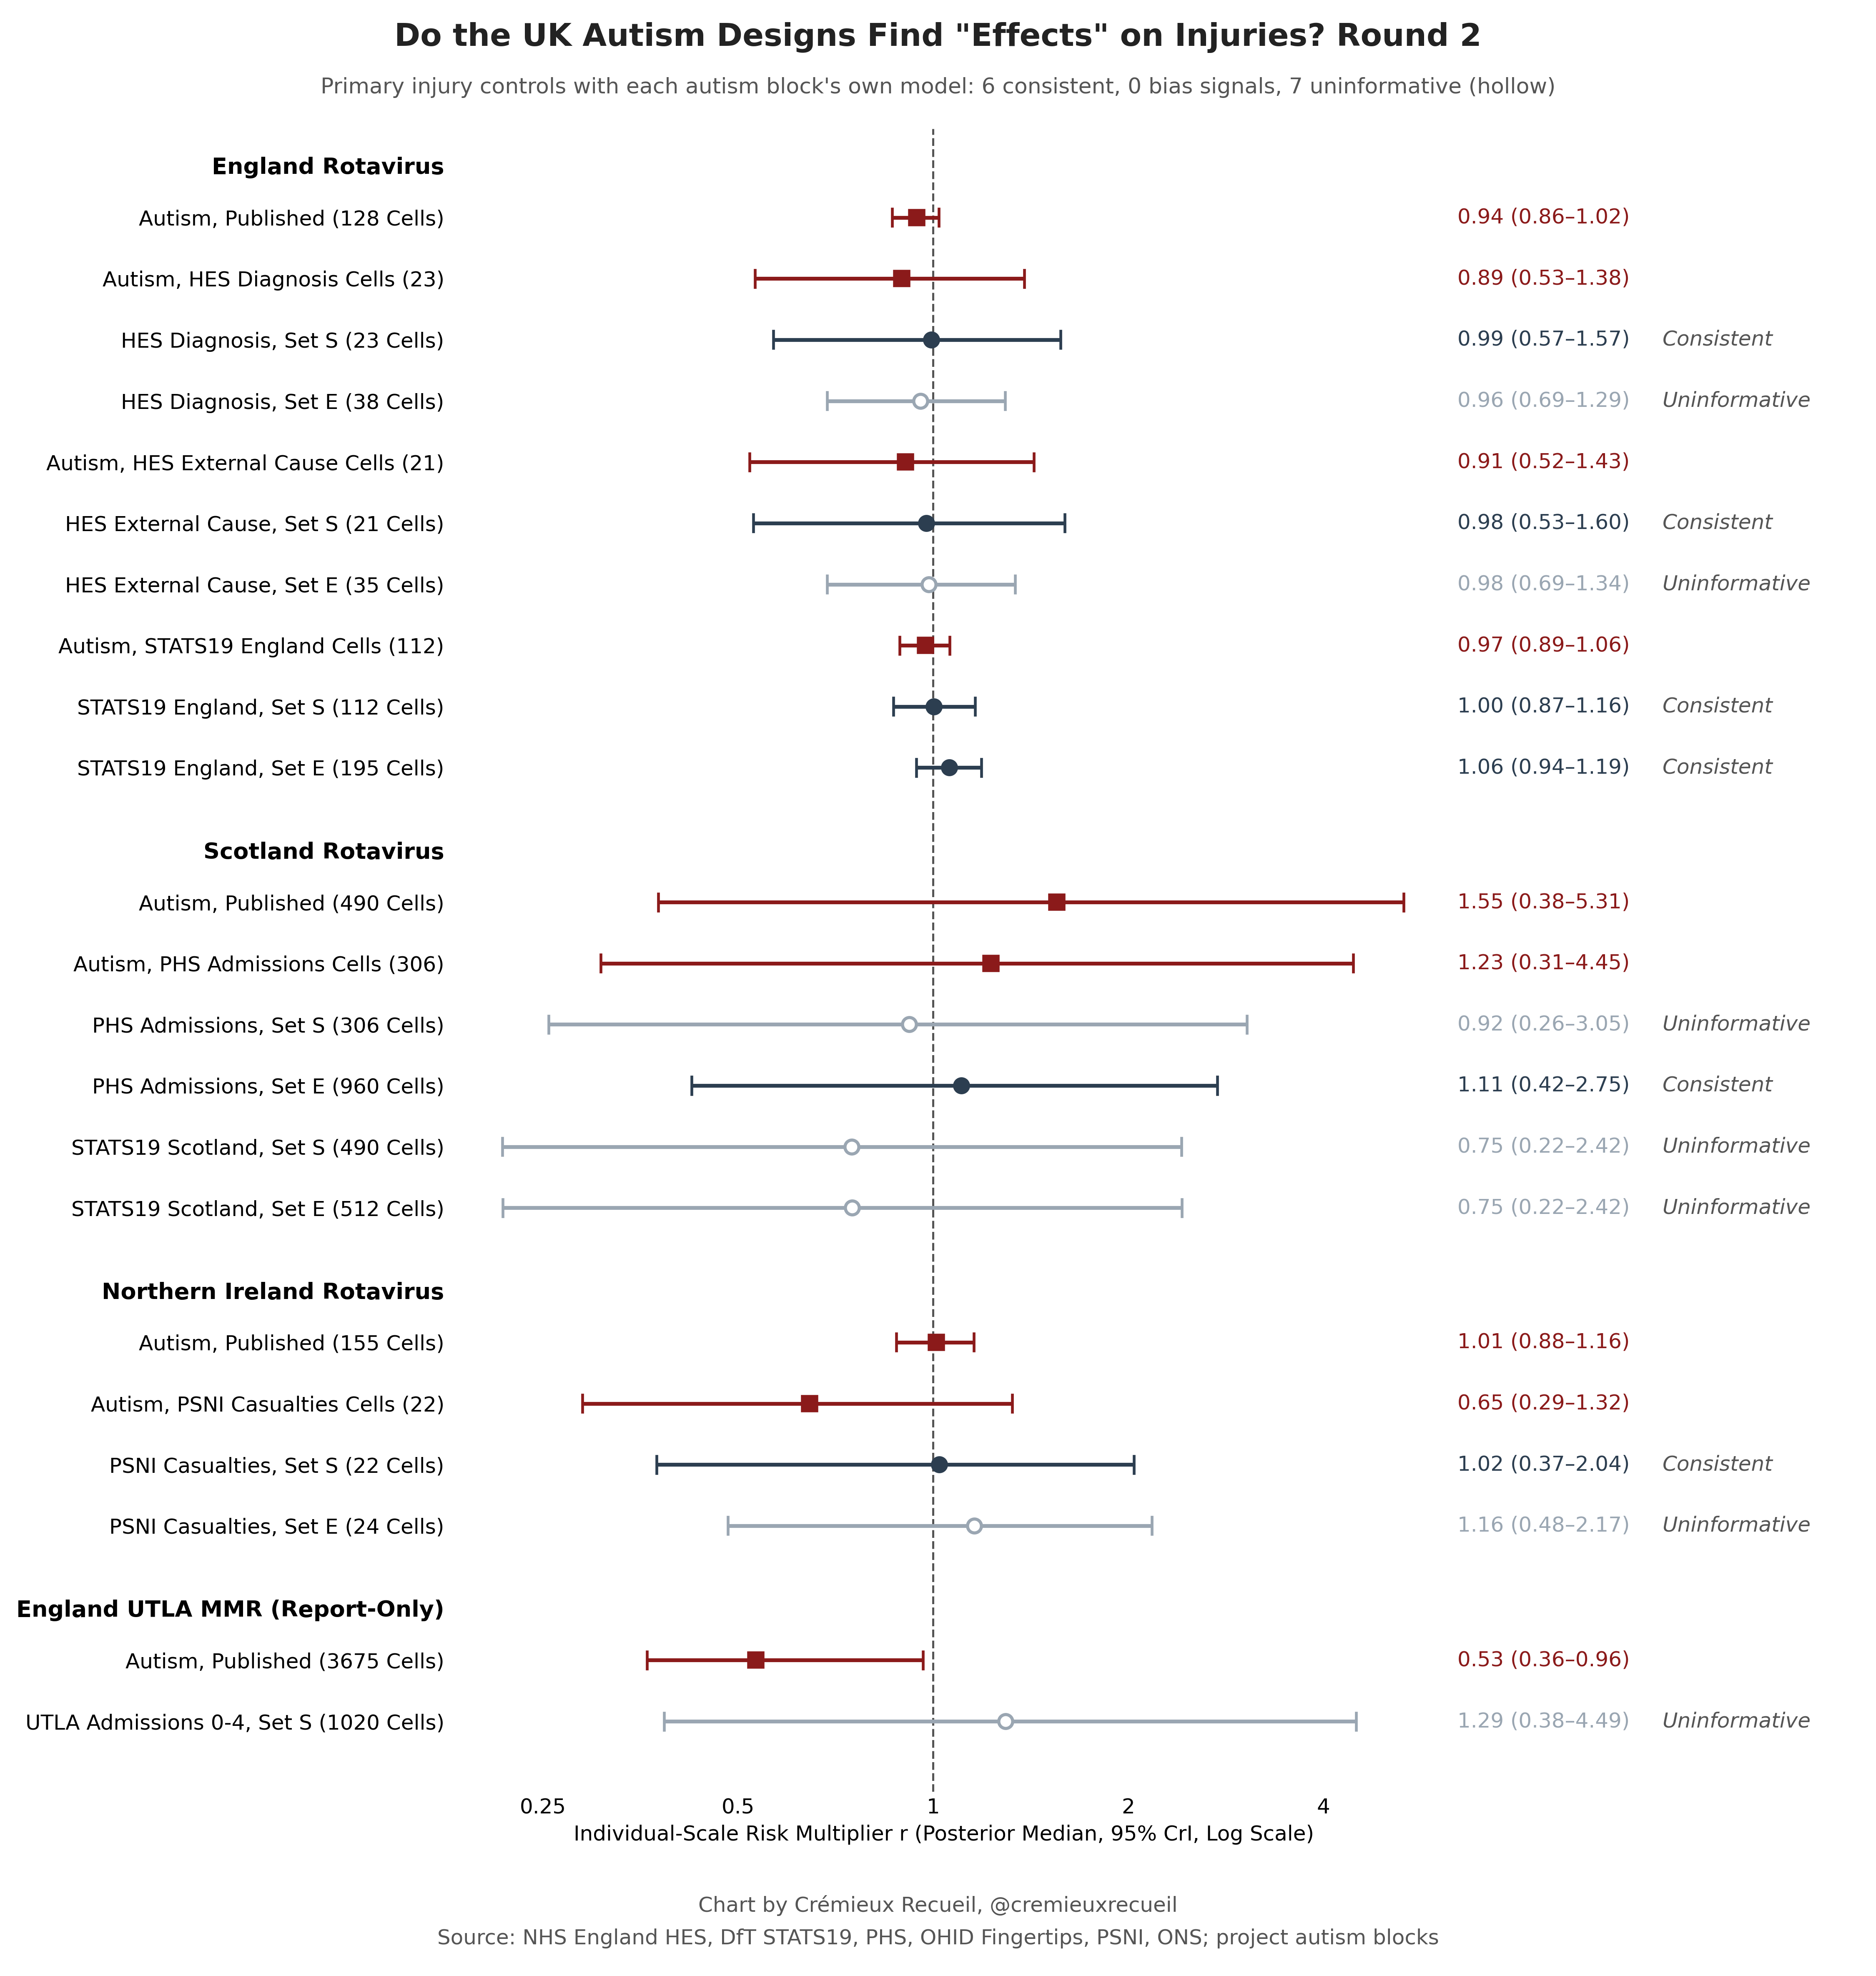
European injury controls, round 2Sweden, Germany and Czechia
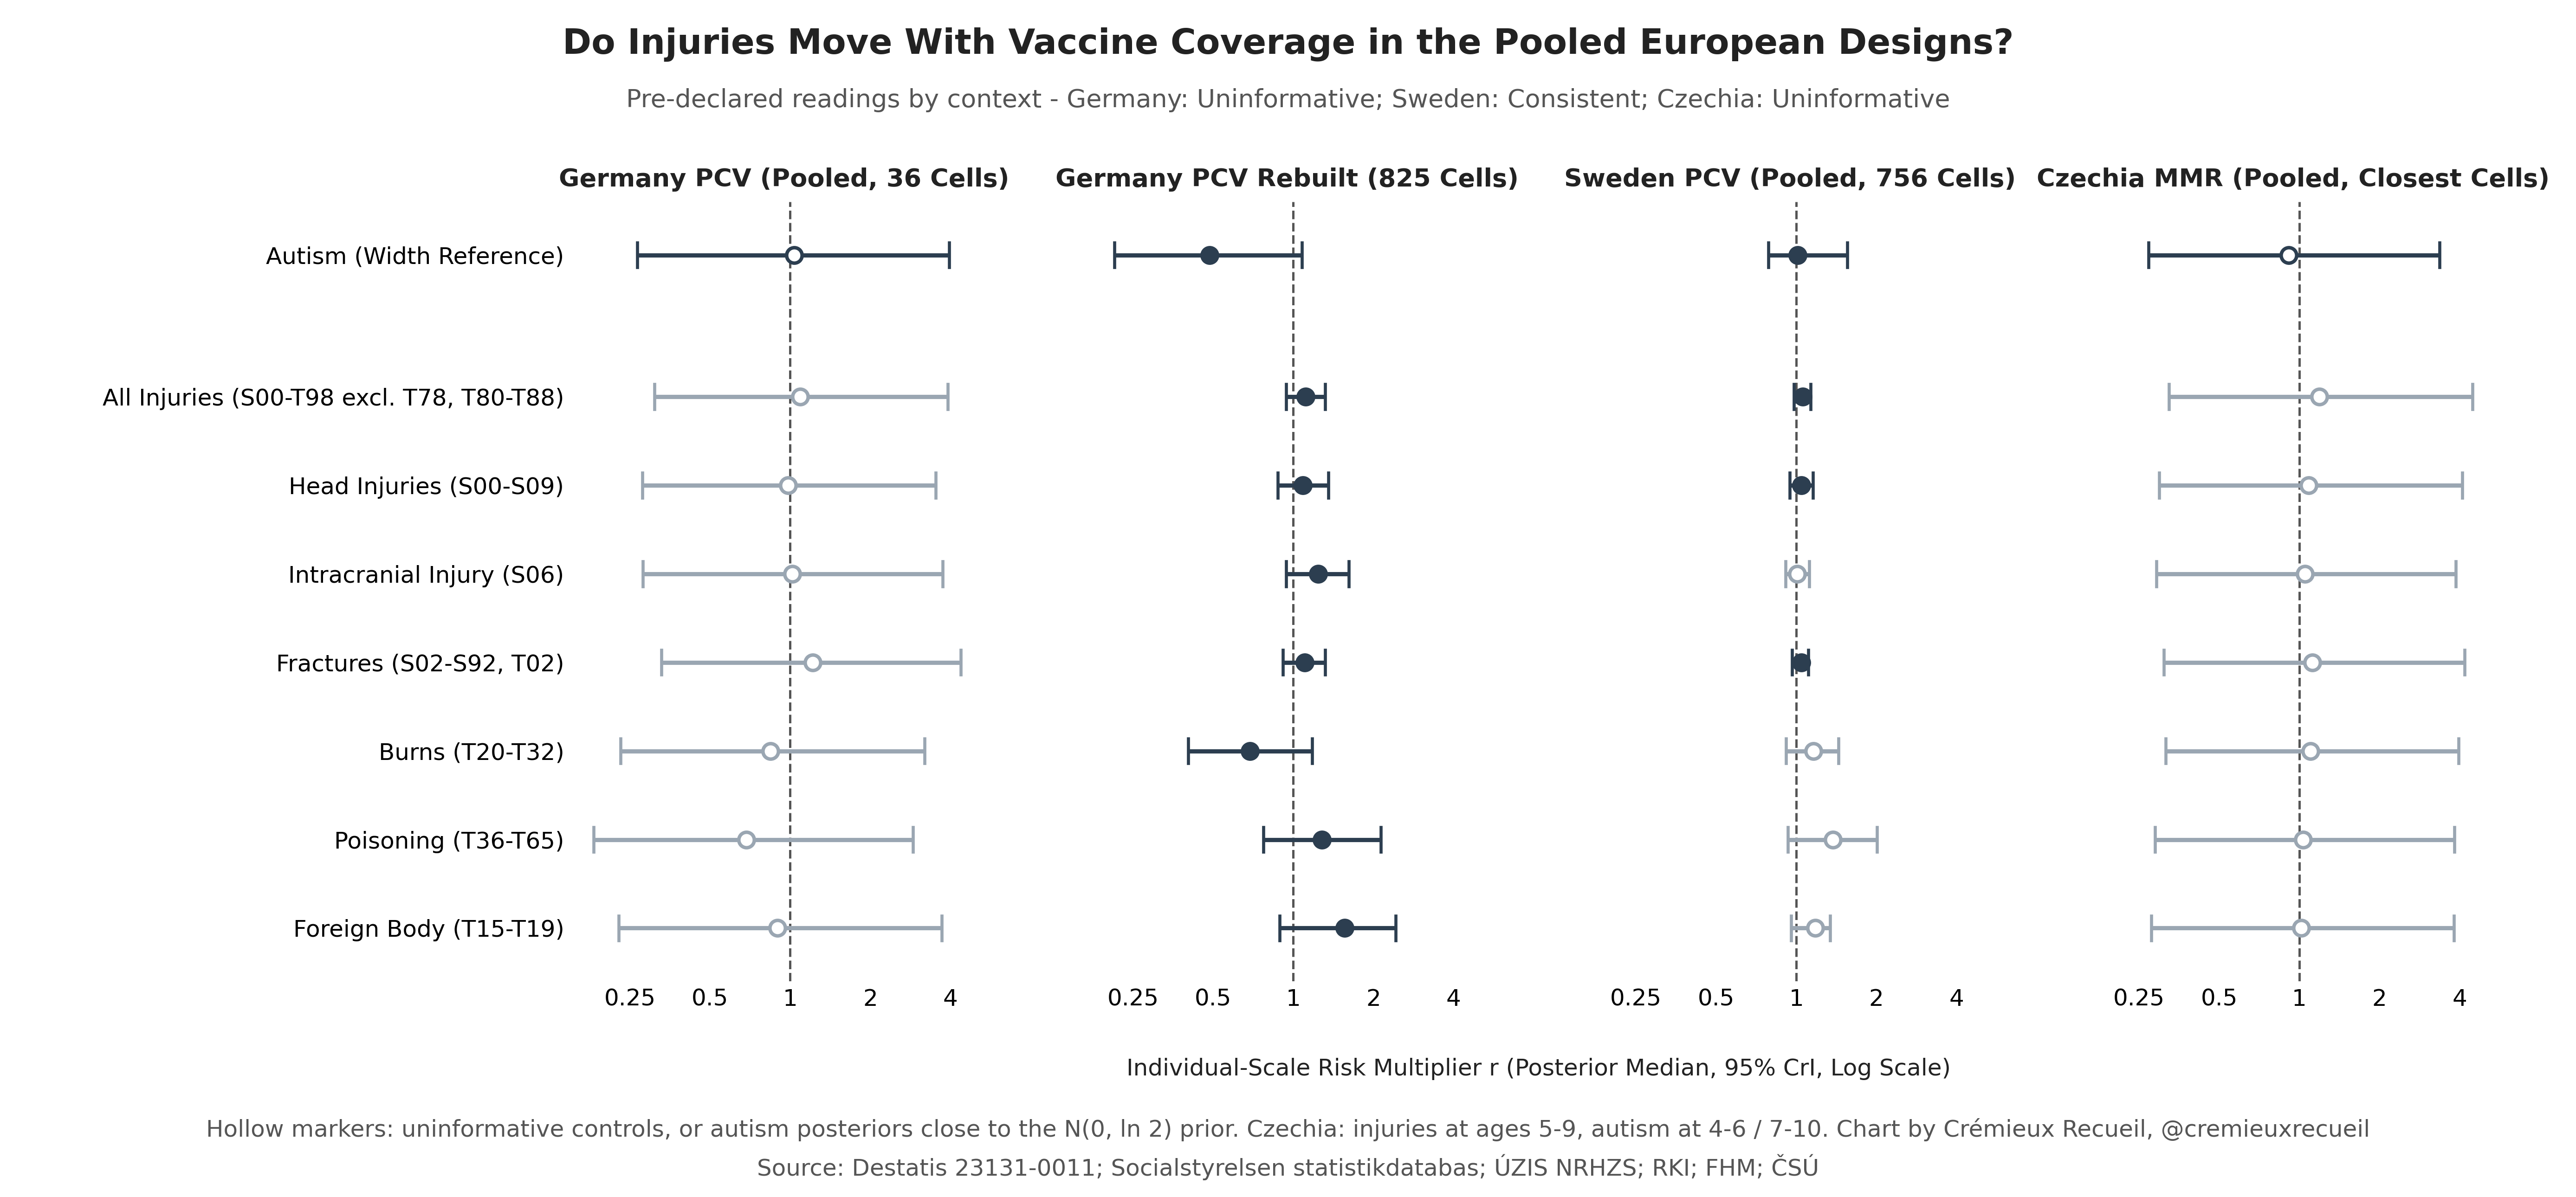
Brazil injury-death controlsSIM external-cause deaths on the census cells
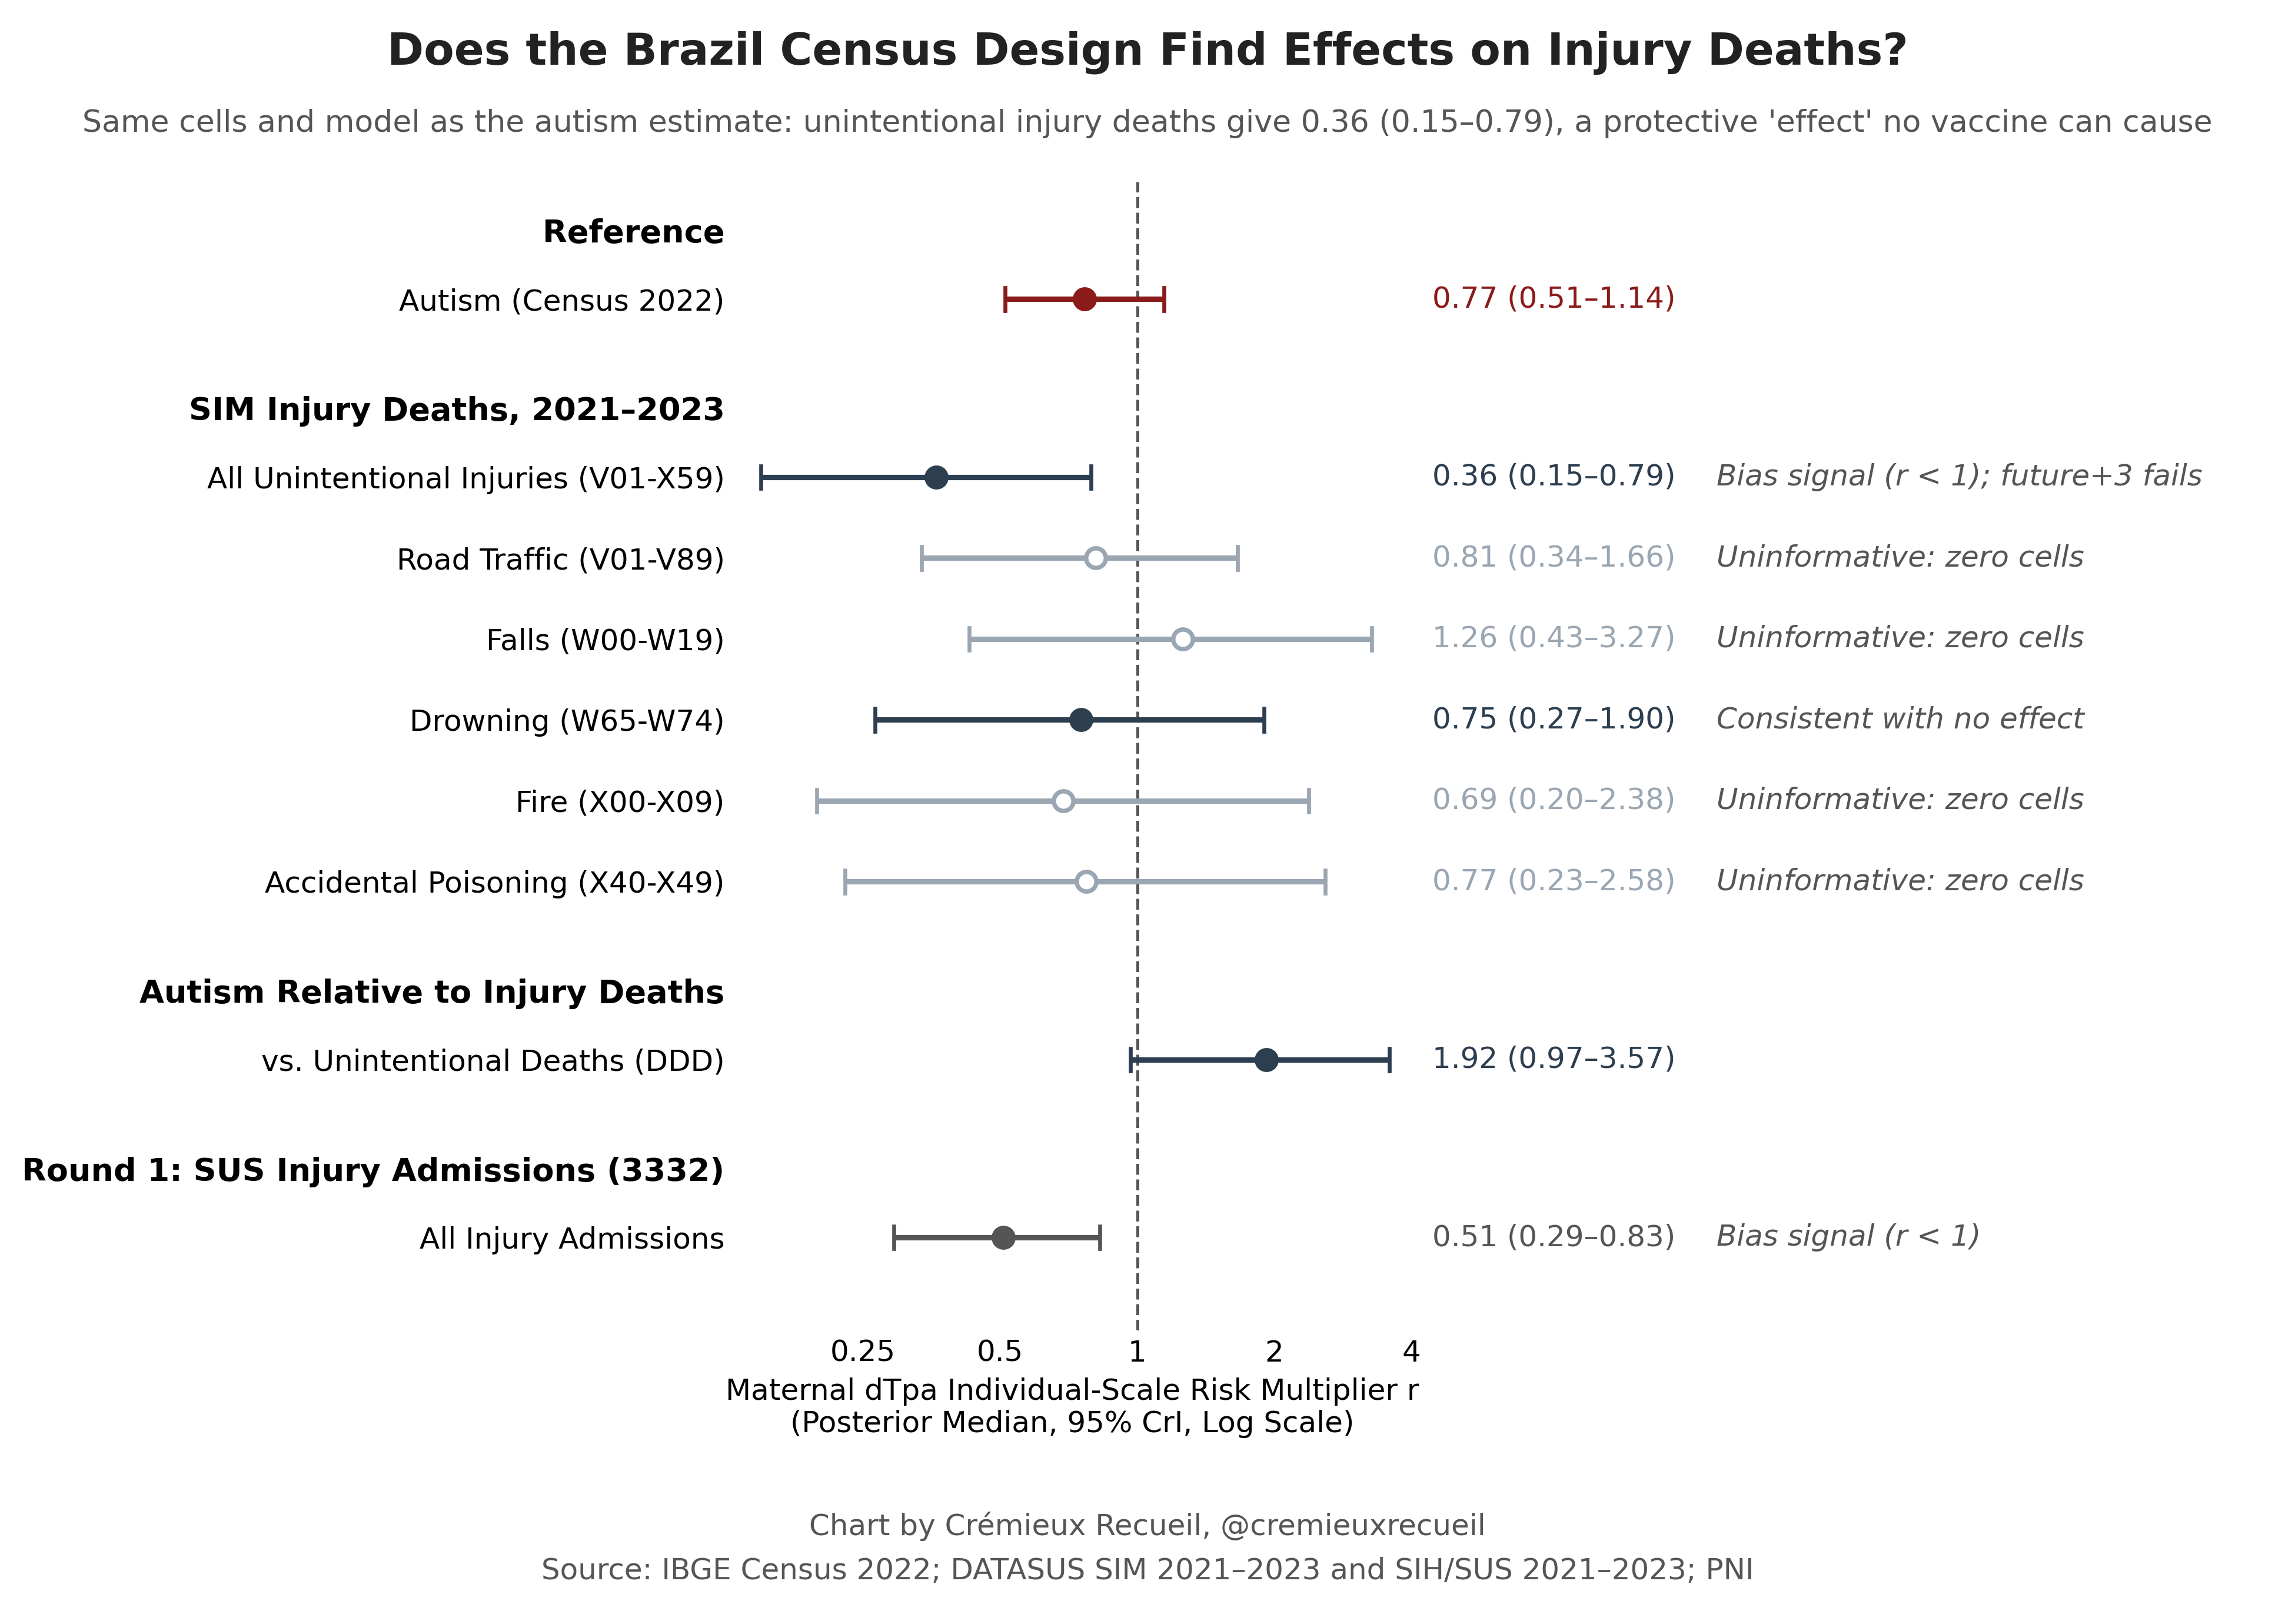
U.S. injury-death controlsNCHS child injury deaths on the U.S. core design
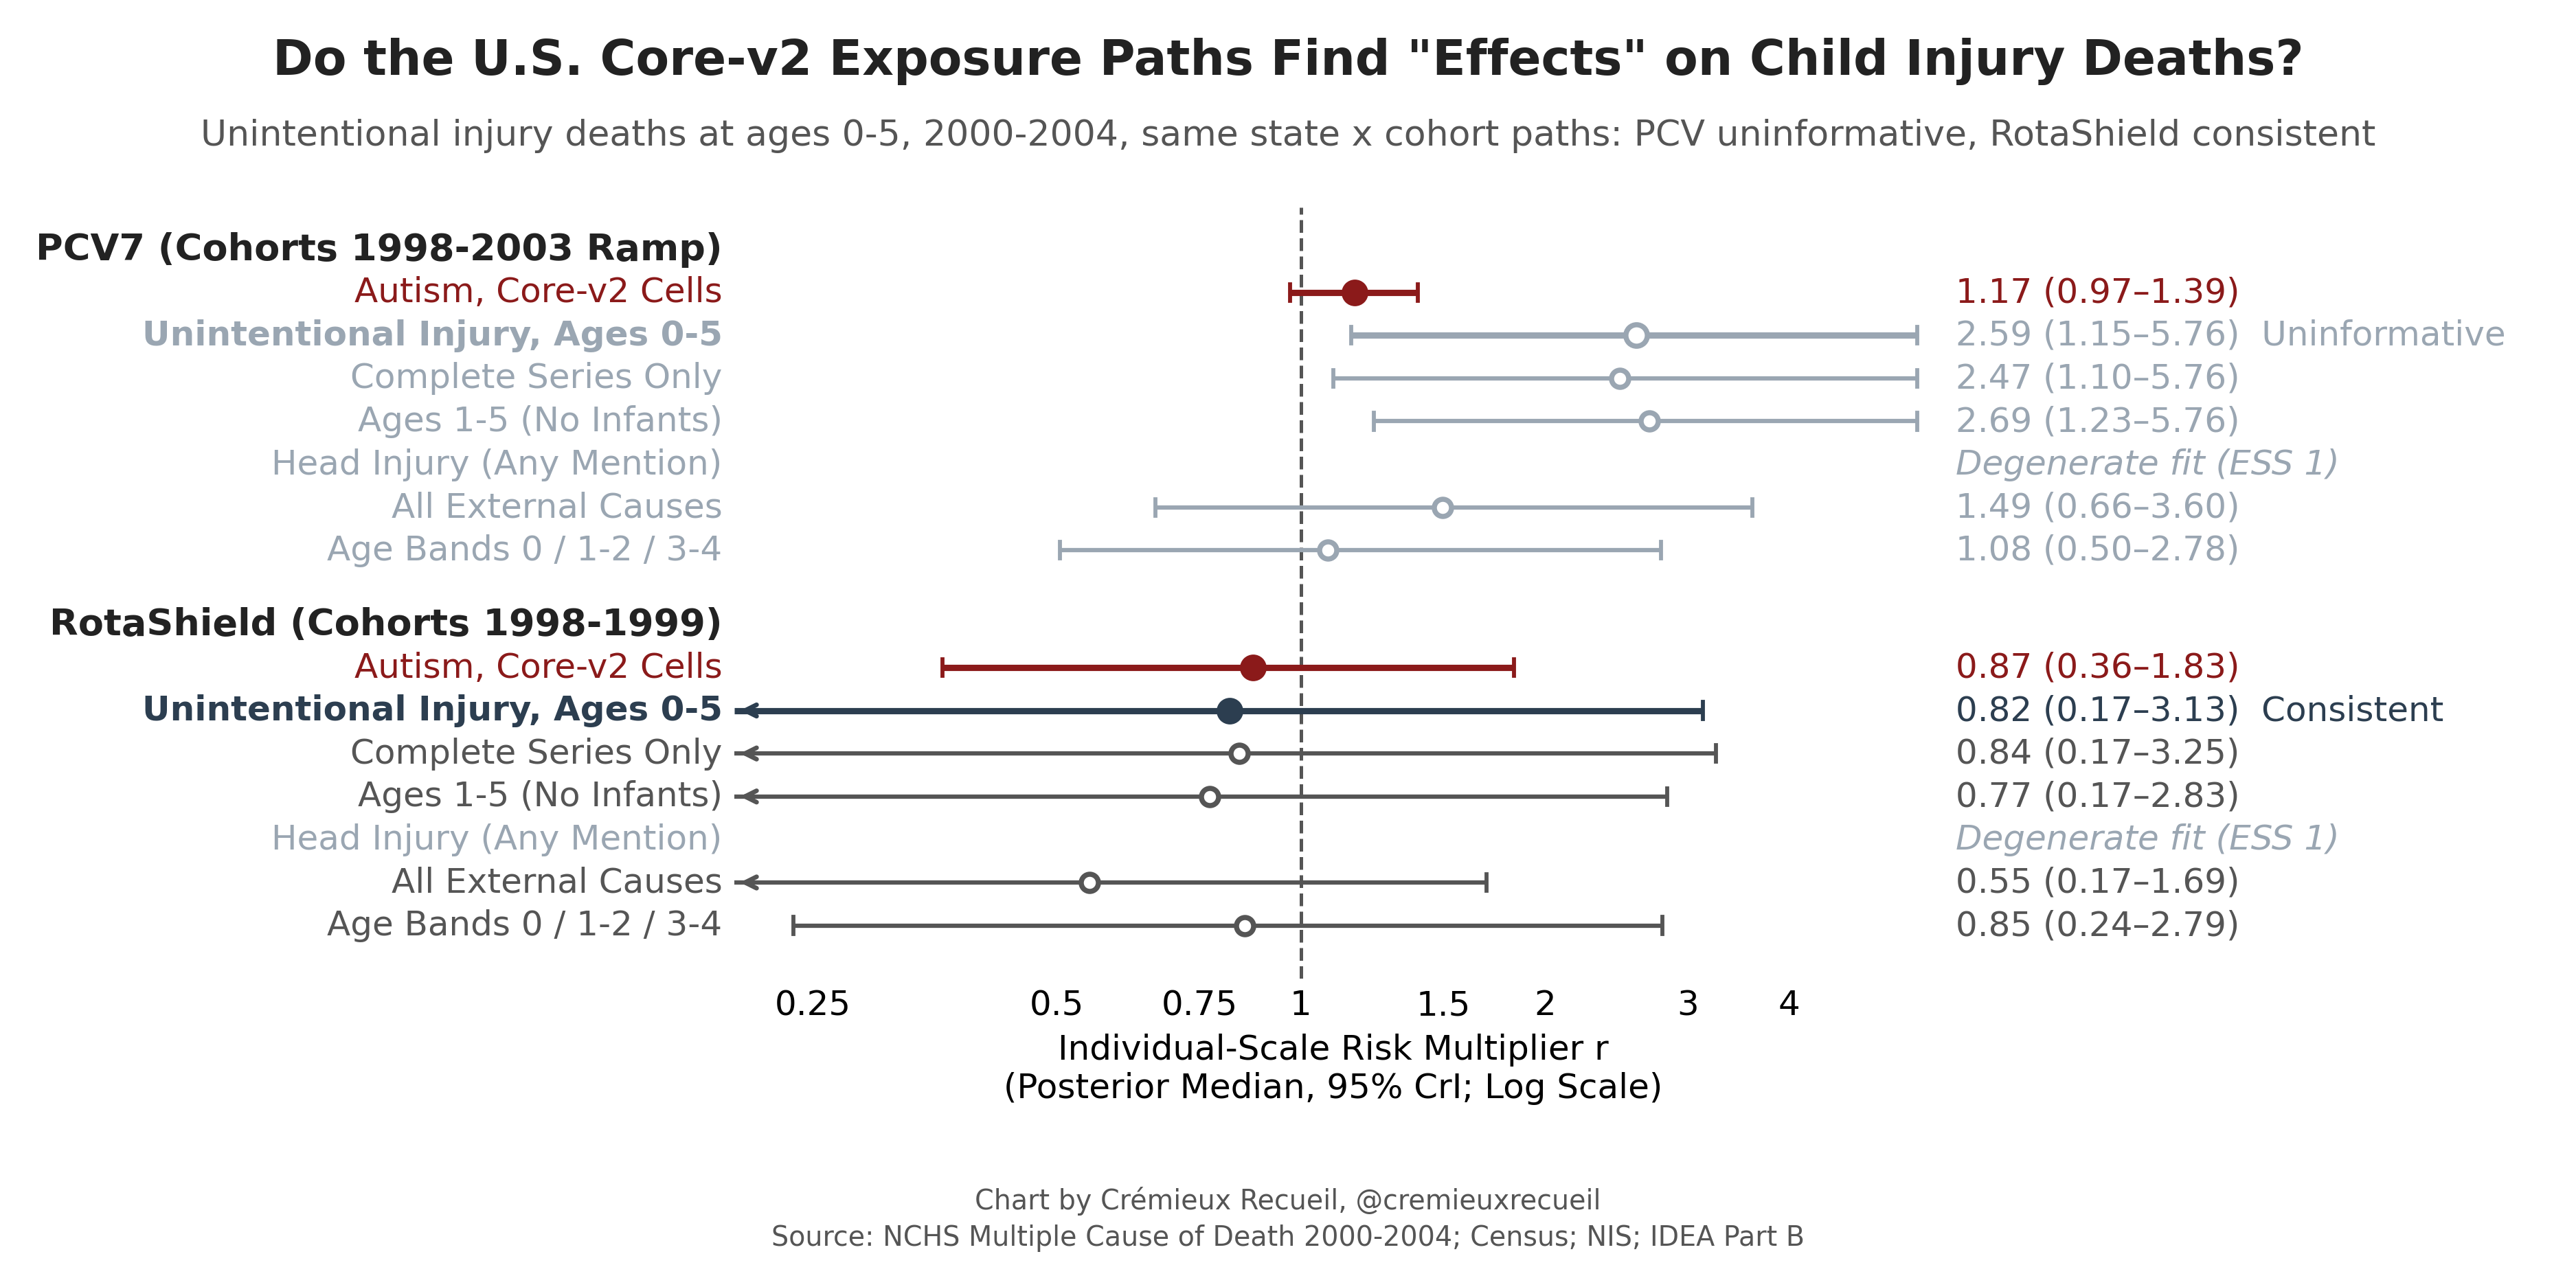
Canada asthma controlsCCDSS asthma on the Canadian rotavirus cells
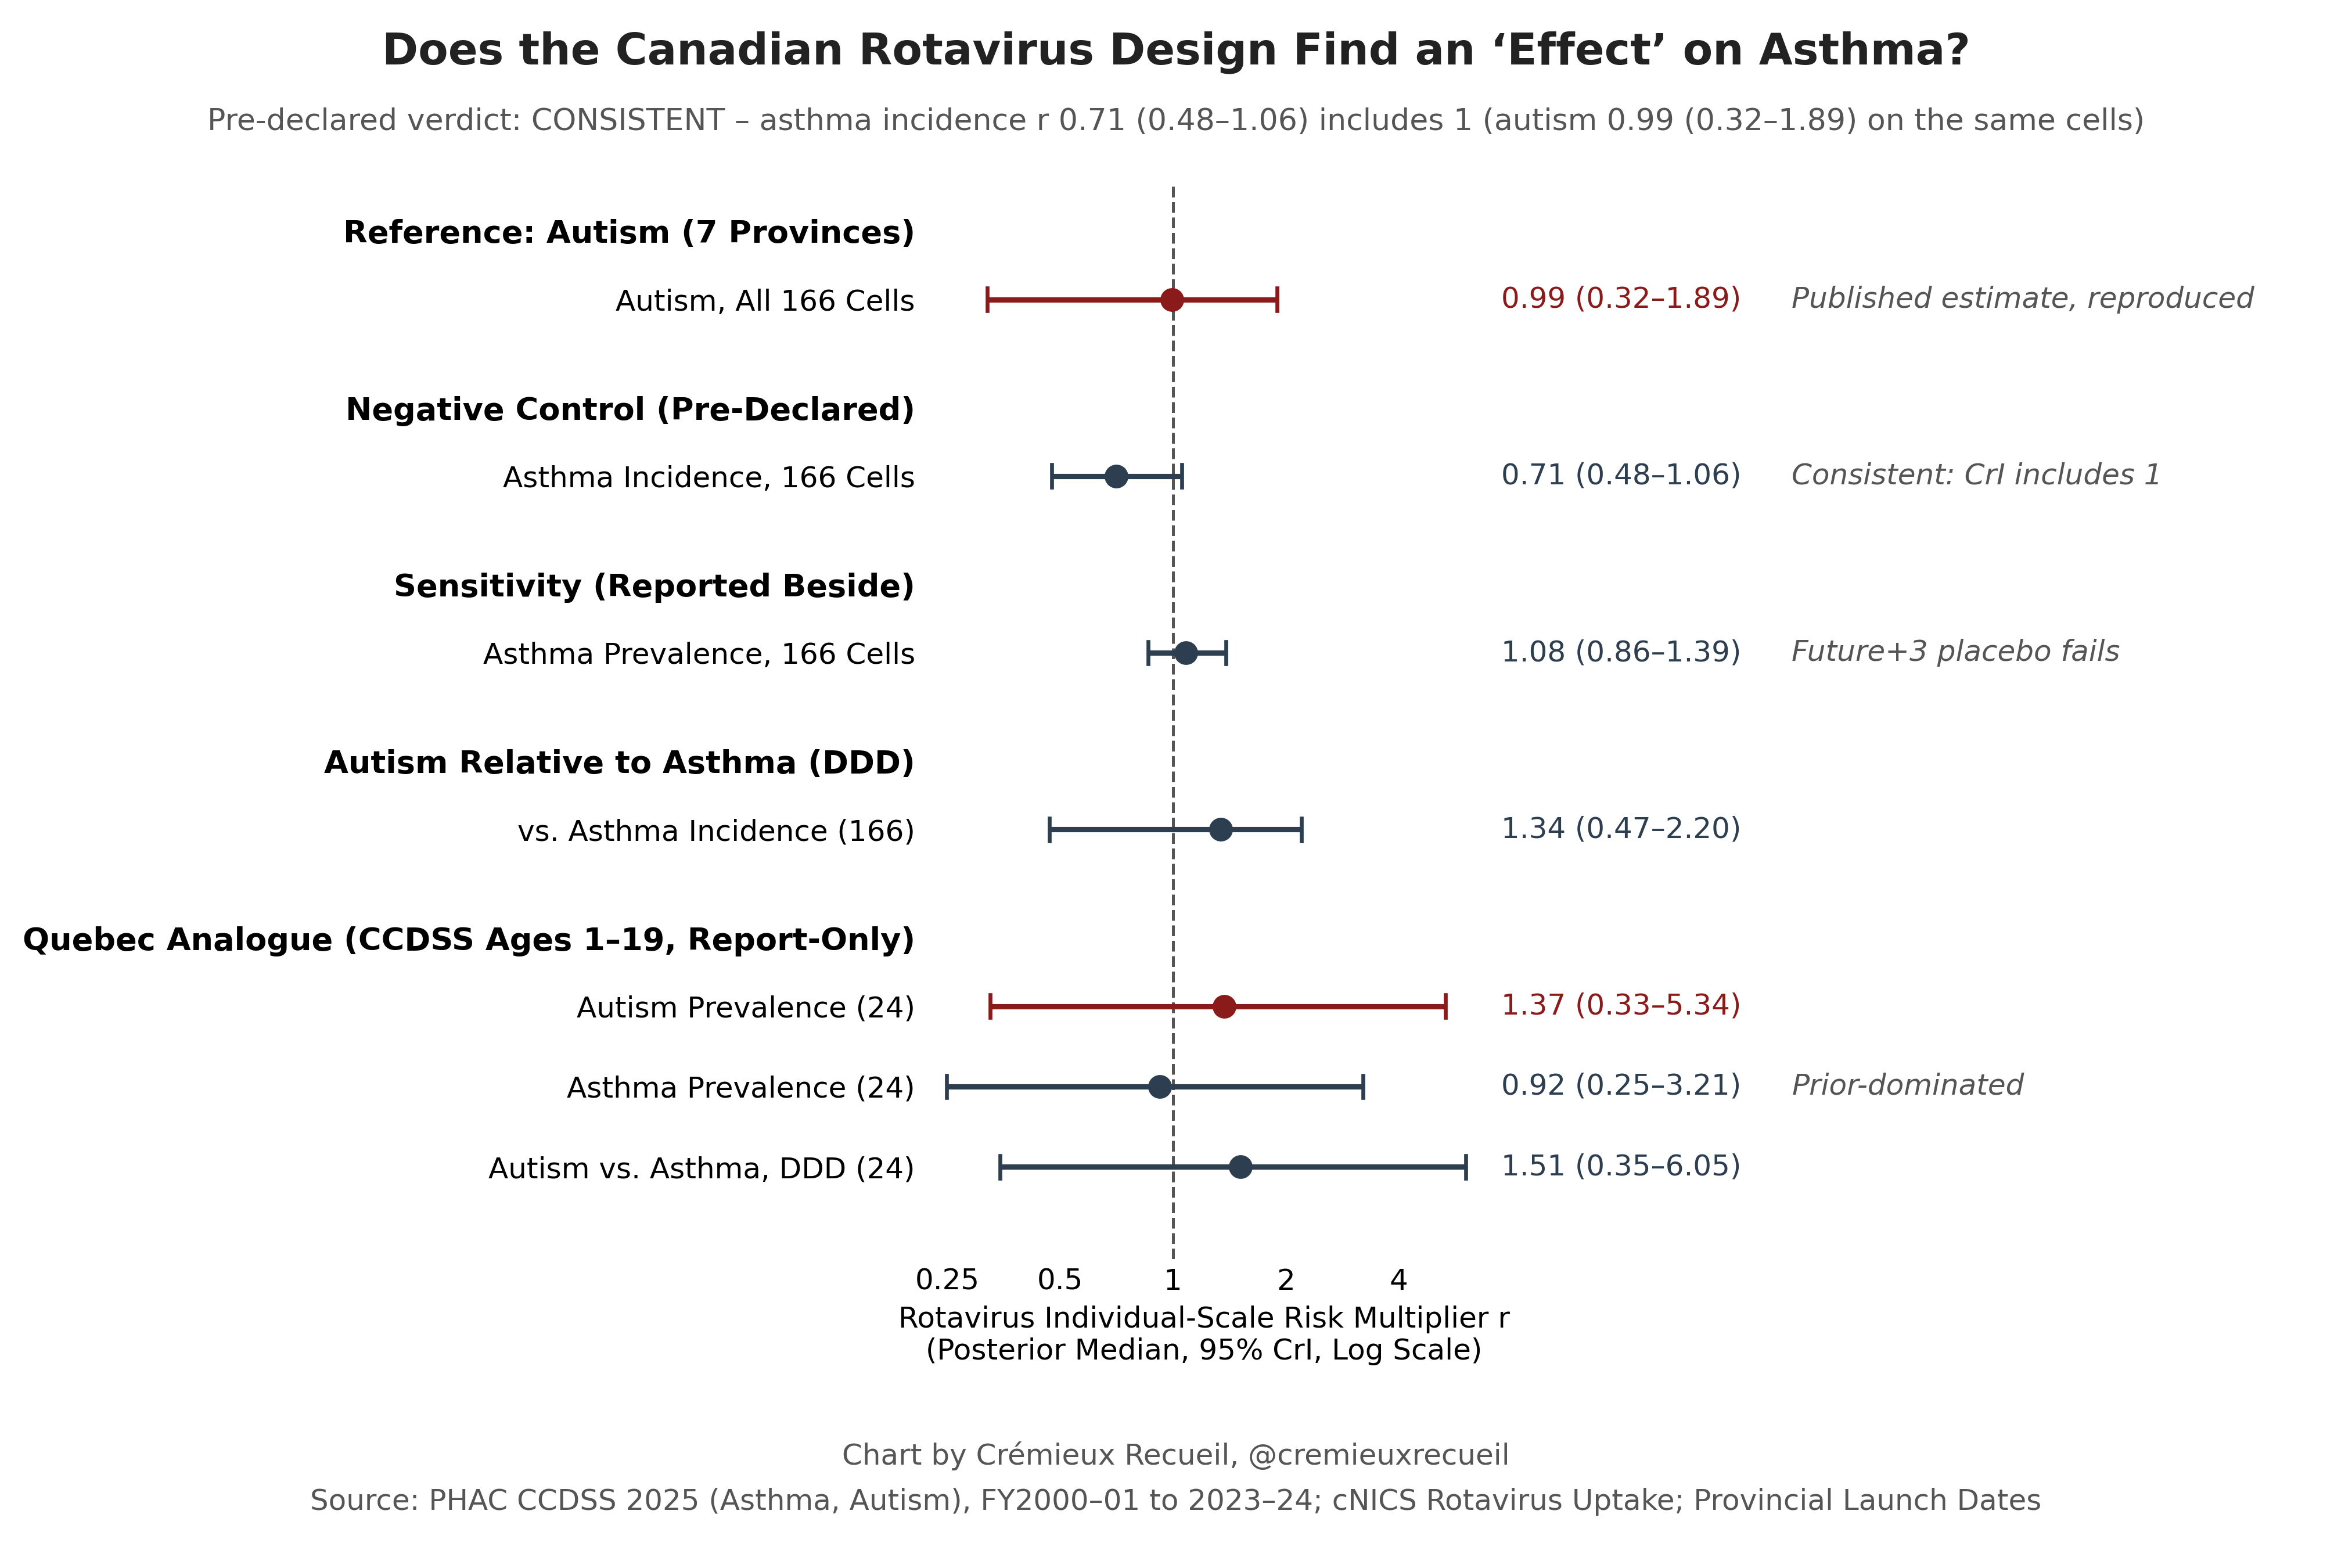
Colombia, Hong Kong, Japan and Taiwan controlsRound-2 injury controls from newly approved downloads
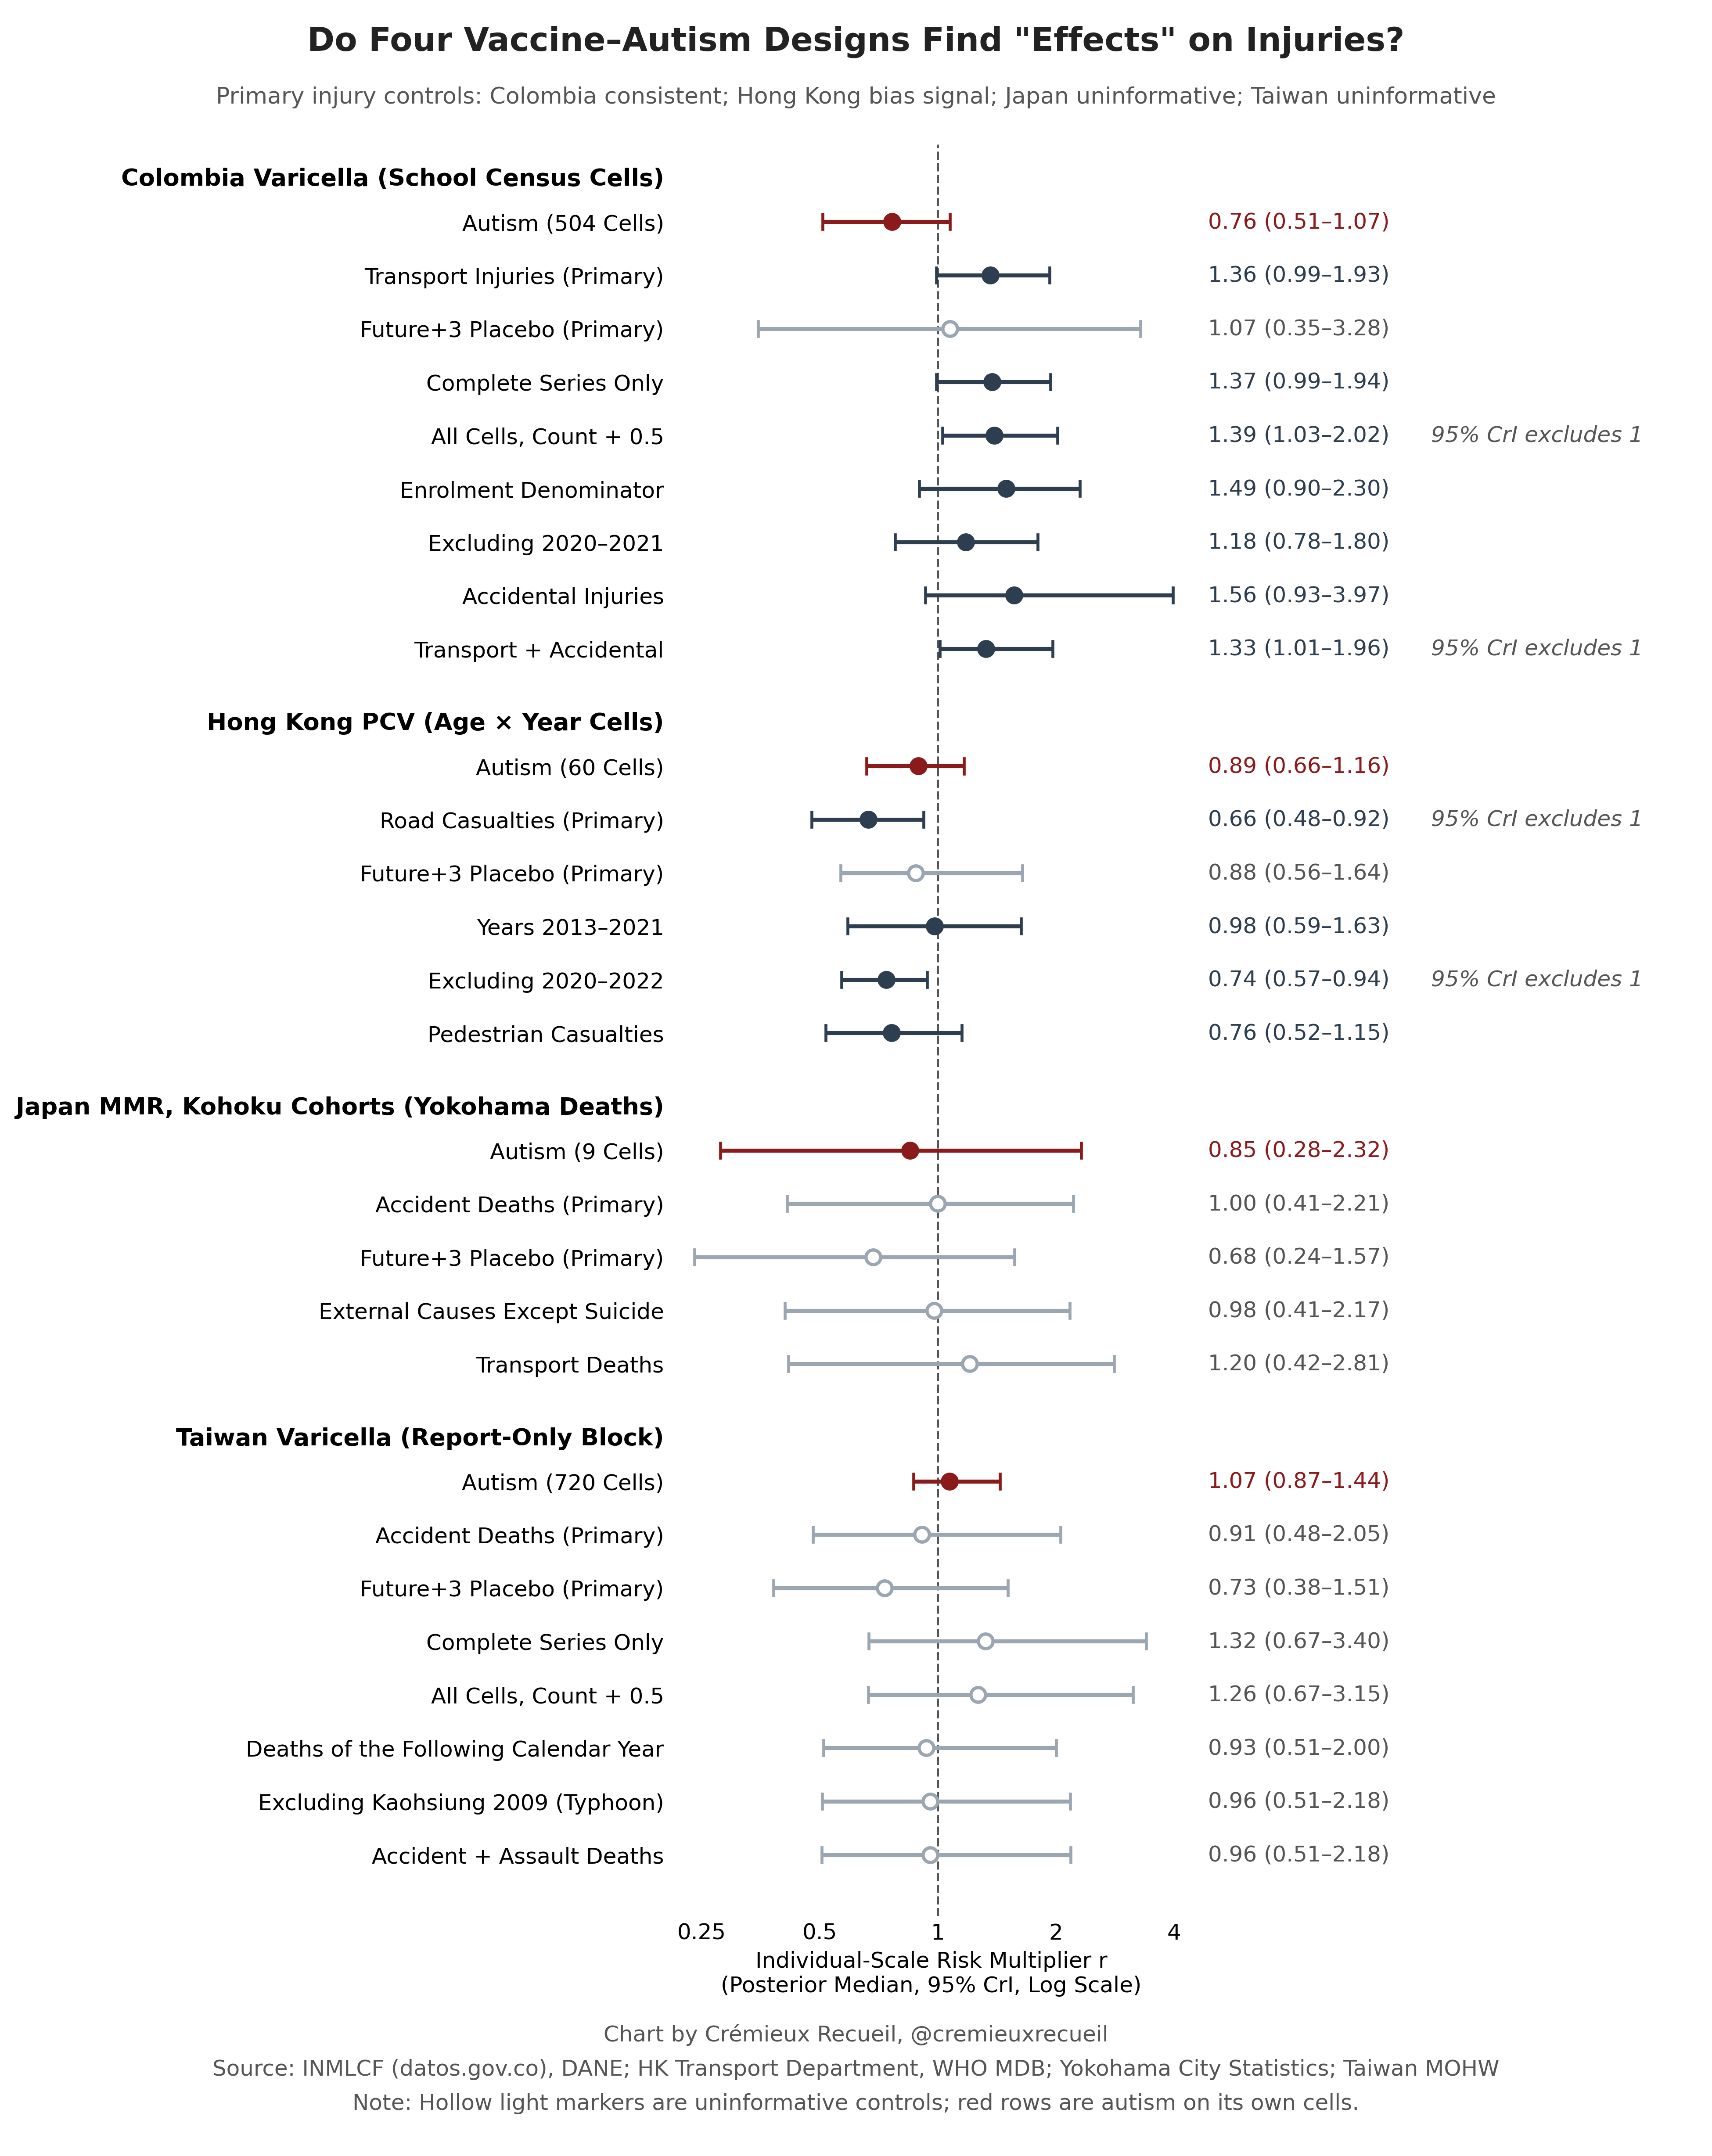
Cross-design convergence panelOne row per setting and design, with overlap labels
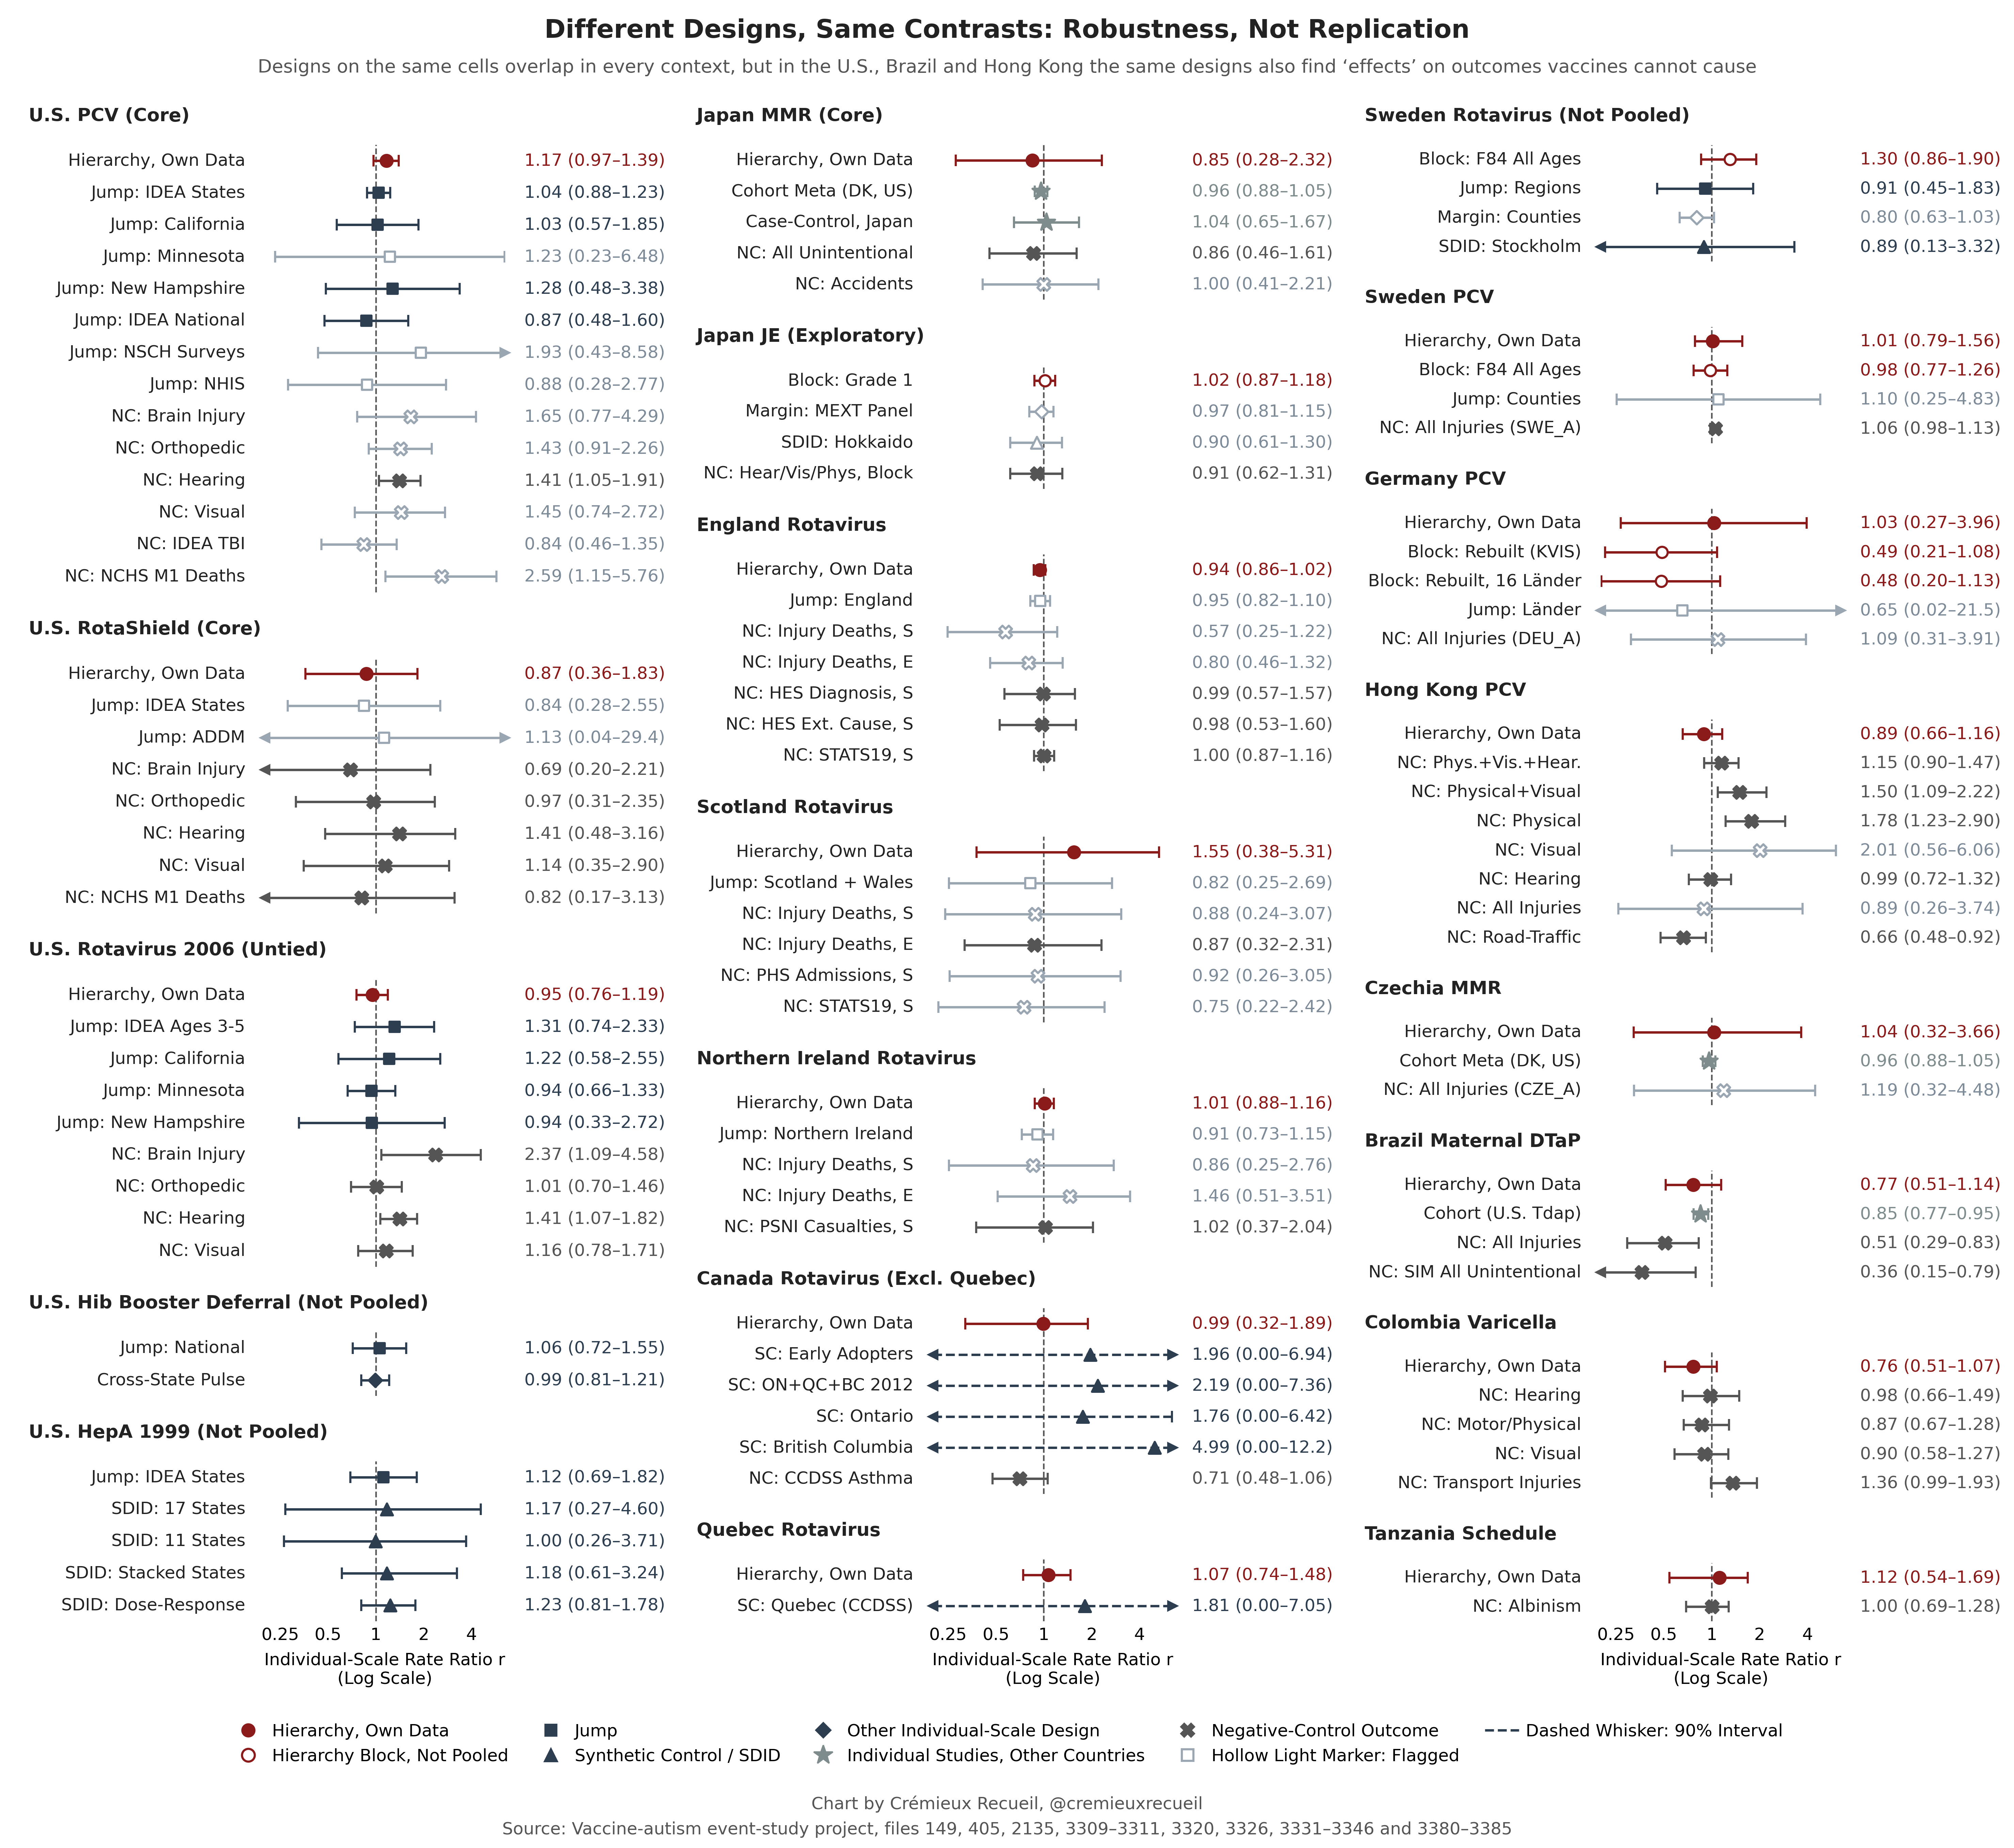
Vaccine-pair interactions27 vaccine pairs and the interaction hyper-mean
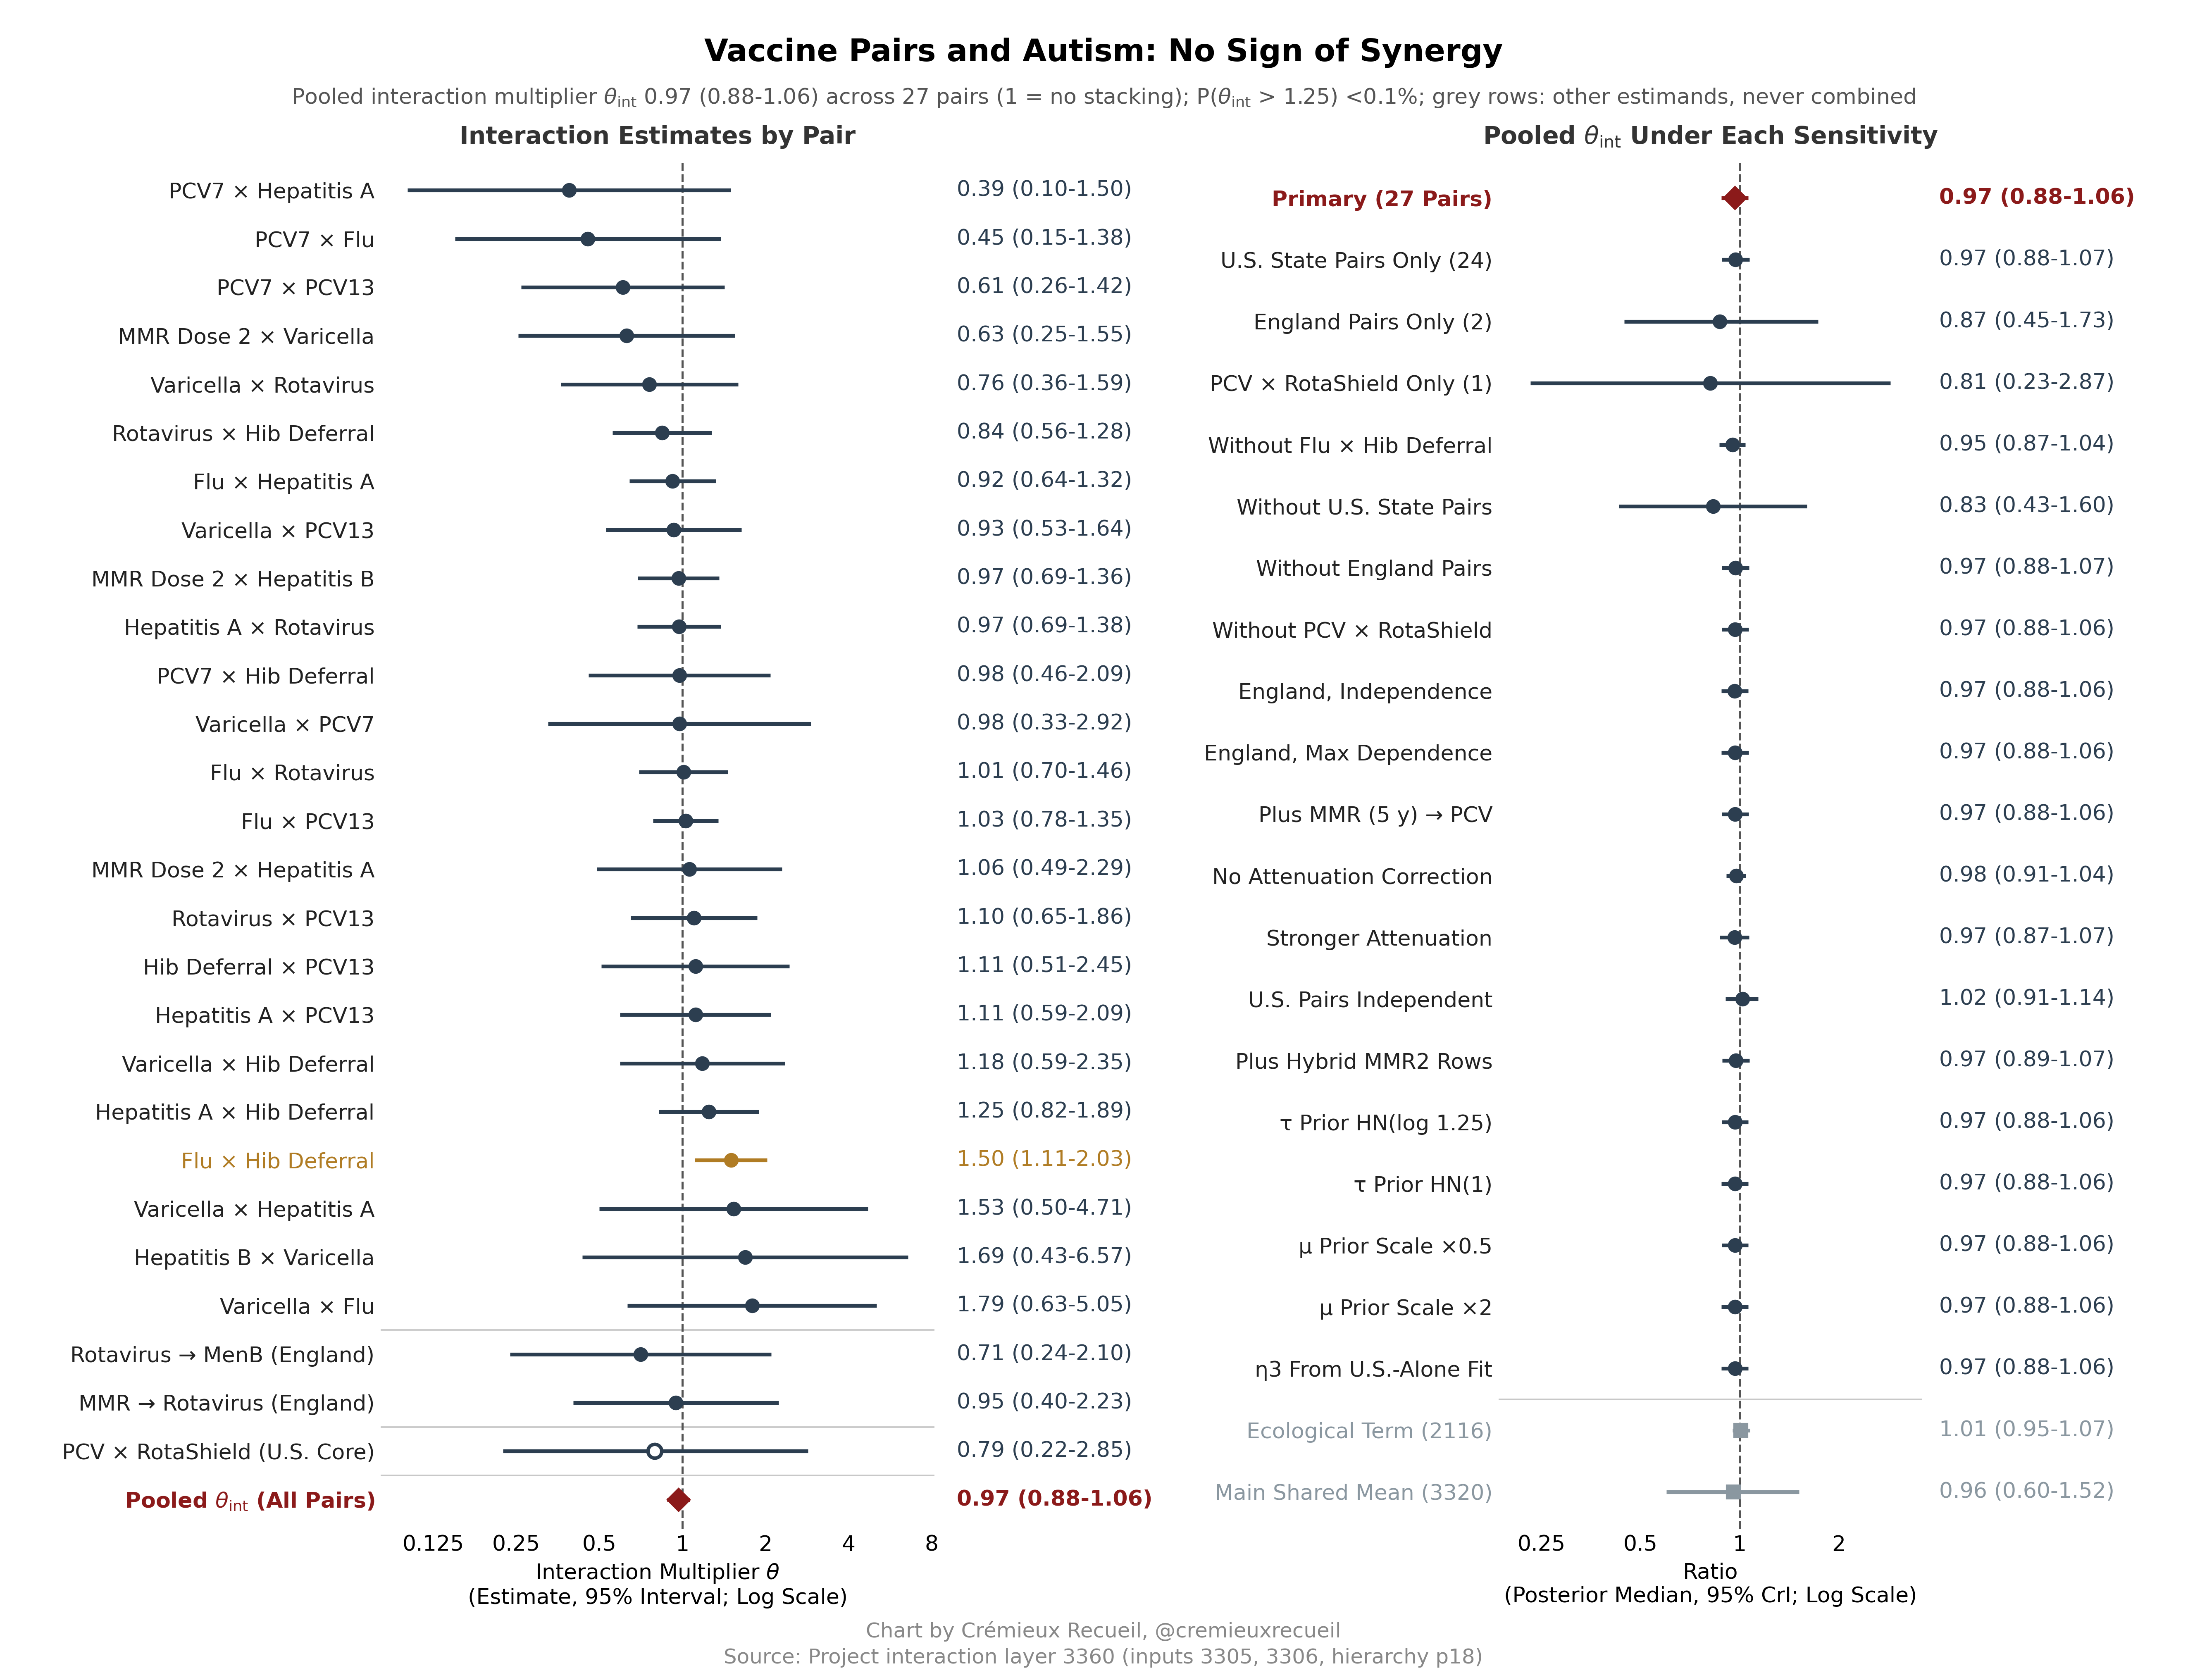
Schedule-load meta-regressionsLoad, age at first dose and same-vaccine consistency
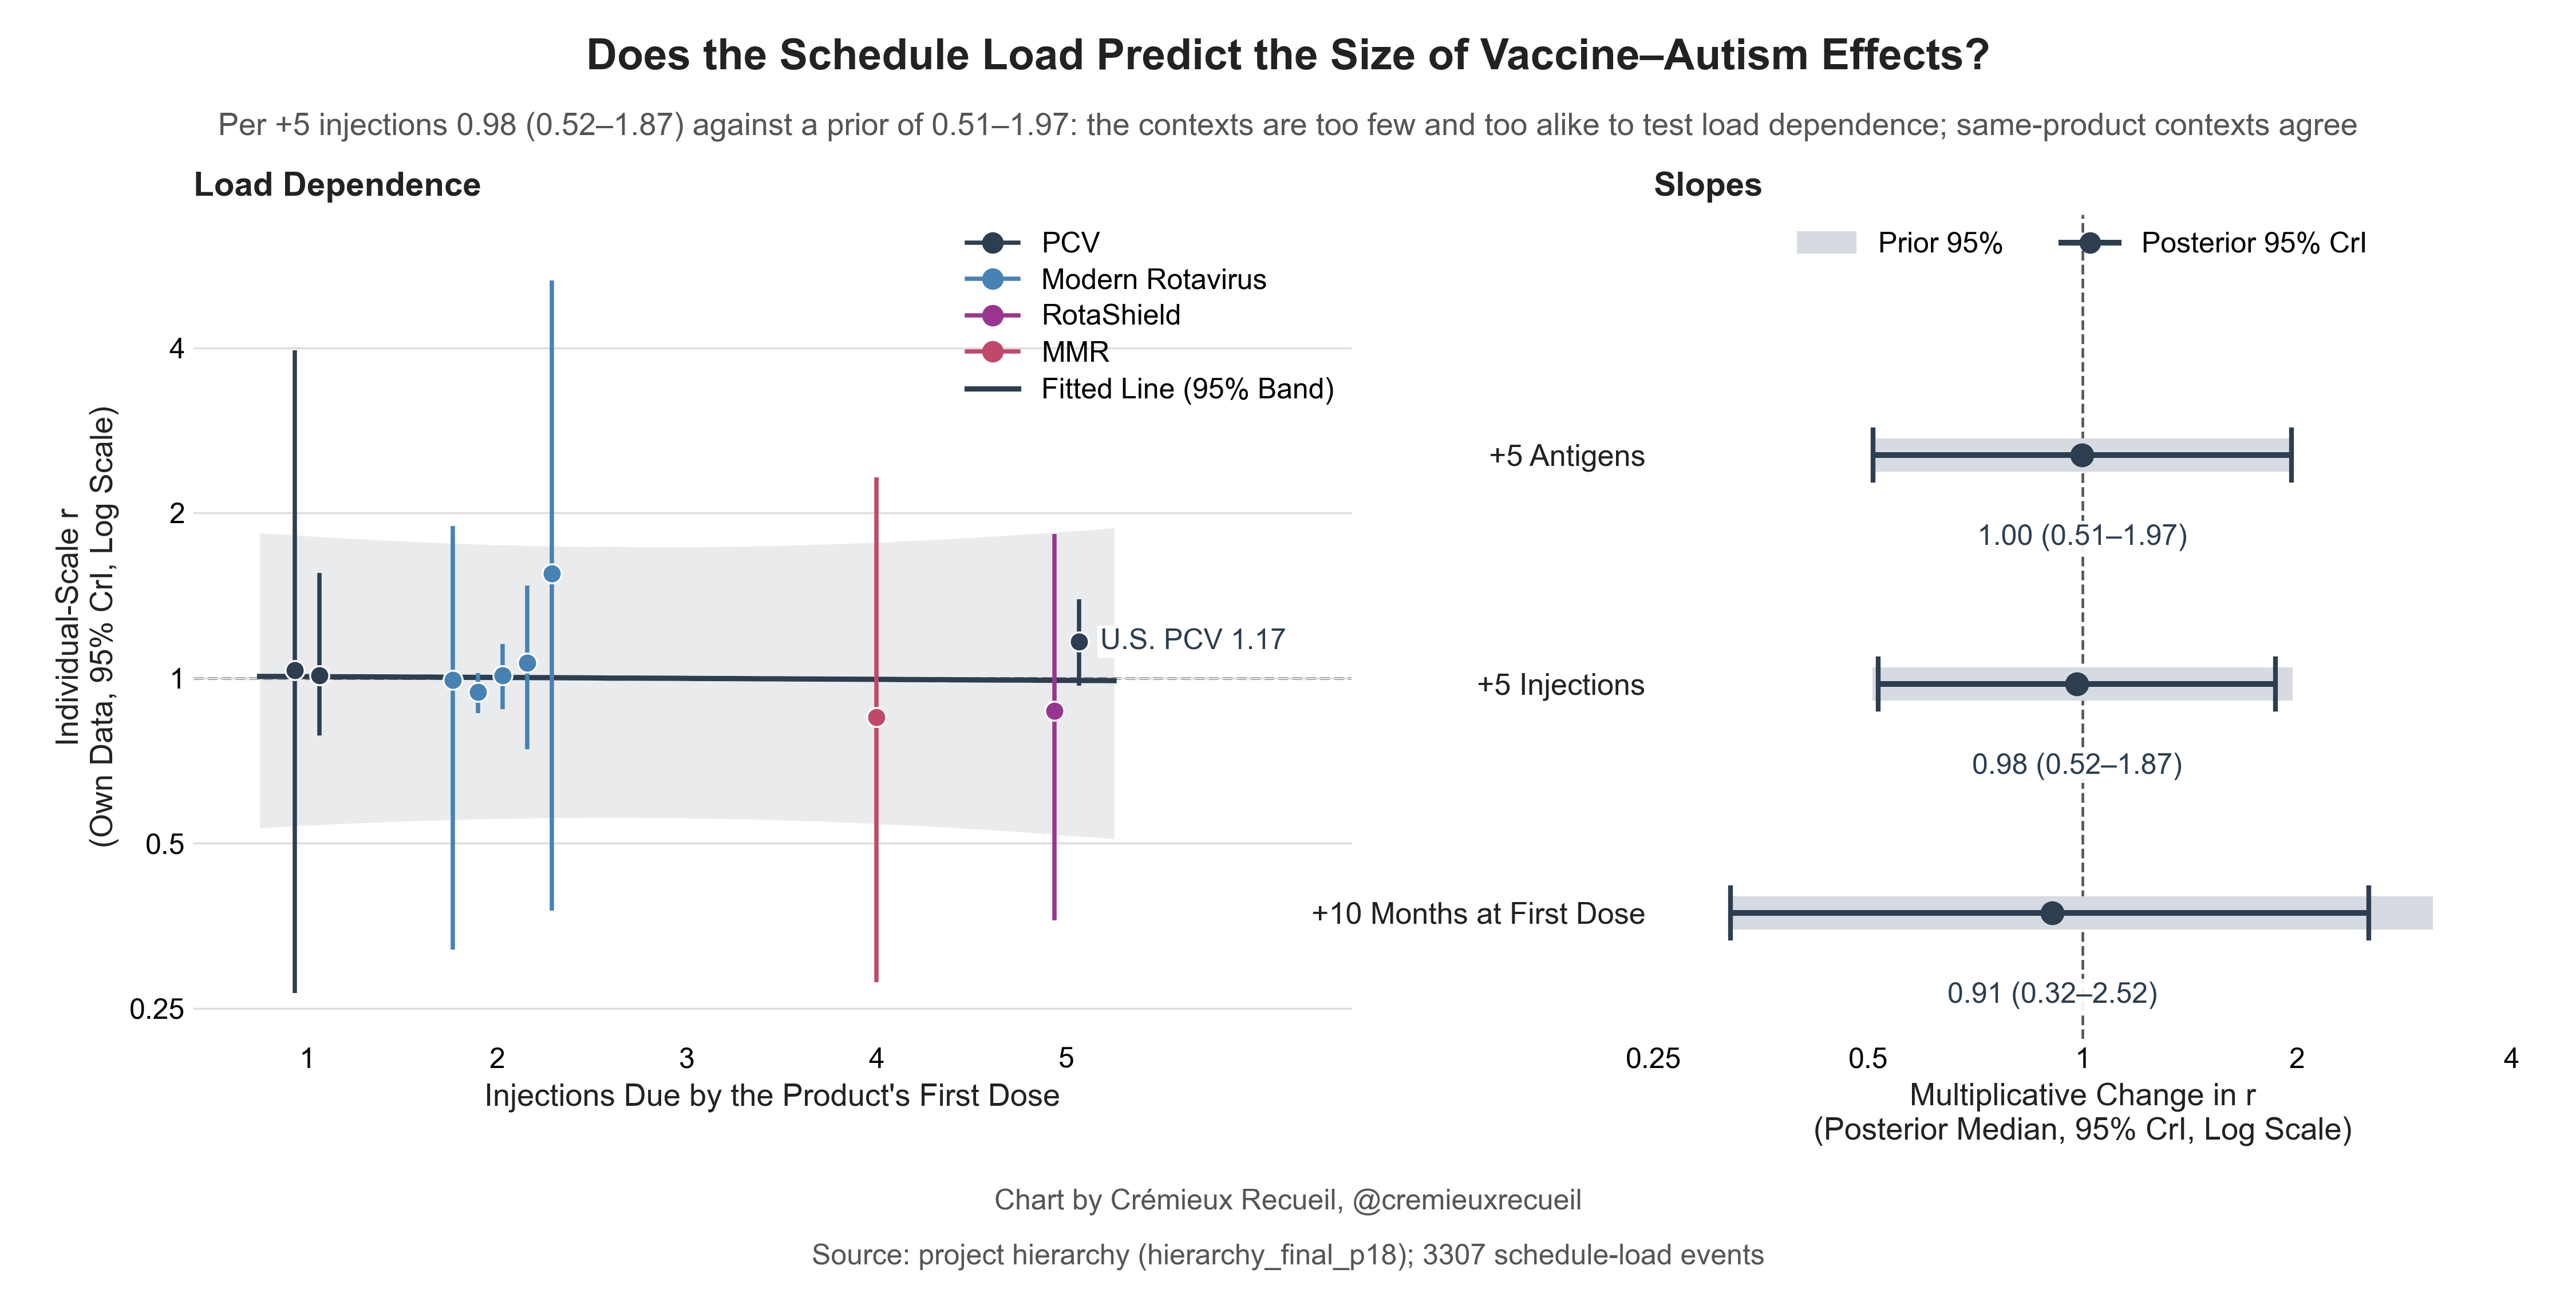
Harm-direction registerEvery harm-direction estimate with its placebo, pretrend, multiplicity and first-stage diagnostics
Reproduce the results
Everything needed to rerun the main result
Where every input came from, the code that turns it into the estimate, the rules it follows, and the fingerprints that confirm you got the same answer. The site does not host the data: each source links to its publisher, with the name and SHA-256 fingerprint of the file we used.
563source parts used24,531source files, each with a SHA-25681%of files linked to their original address881dated schedule changes, each with its citation473scripts in the code bundle
Five steps
- 1Get the sources
Download each file from the address in the source list and check its SHA-256 against ours. Files taken from archived pages are linked to their Wayback Machine snapshot. Sources available only on request, or not at all, are listed with the reason and, where there is one, the agency to ask.
Sources, one row per part compressed CSV · 122 KB · Every source file, with address, date and SHA-256 compressed CSV · 1.9 MB · Sources we could not obtain compressed CSV · 159 KB
- 2Get the code
The bundle holds the 473 scripts the result depends on: the adapters that read each original file and check it against the totals its publisher printed, plus the data factory, the estimator and the reporting scripts. The manifest gives each script’s SHA-256 and role. 2 download scripts are withheld from the bundle because one embeds an access key and the other an e-mail address; both are listed, with their fingerprints, in the manifest and the exclusions file.
Code bundle ZIP · 3.8 MB · Code manifest compressed CSV · 29 KB · Withheld scripts CSV · 1 KB
- 3Follow the rules
The analytical specification identifies eligible sources, their roles and the data cutoff. Use its rule files with the corresponding input archive. The event list gives the dates, first affected birth cohorts and citations. These analyses were not preregistered. Analysis choices were documented during the project, including after earlier results had been examined. Rule files and hash records document computational settings and provenance; they do not establish preregistration. The timing of choices is documented in Supplement EA2.
Amendment record Markdown · 126 KB · Schedule changes and citations compressed CSV · 33 KB
- 4Run it
The guide gives the folder layout the adapters expect, the commands in order and the computing environment we used.
Reproduction guide Markdown · 14 KB · Folder layout compressed CSV · 24 KB · Environment JSON · 8 KB · How this package was built Markdown · 12 KB
- 5Check the answer
You should get a per-child relative risk of 0.973 (95% CI 0.836–1.131) from 40 countries and 39,753 comparisons, with the planted-effect and placebo checks passing. Before that, your intermediate files should match these fingerprints; the full set is in the pins file.
All fingerprints JSON · 13 KB · Full results Markdown · 5 KB · Search coverage Markdown · 32 KB
| What | File | SHA-256 |
|---|---|---|
| Autism outcome cells (main design) | cells_primary_v5e.parquet | 411fcdcdb84e5739f4268370626f3ca648d7d9ff48aca37e2273f0bab6d99875 |
| Vaccine uptake, preferred series | exposure_preferred_v5e.parquet | 46fd2ddbb9fa338f25b4464029ec93da8e32946a36e59c1fa52480085ecde153 |
| Schedule changes used | events_primary_v5e.parquet | ae9d3862996027537e33998ea1941f40e72cbc7fed03ee2dd943f7626d1ab02e |
| Design frame: comparison stacks | design/stacks.parquet (frame hash) | 1f10146a04a6b450d7a5c27372bd3871d444e0cc754f7fa7ff80a6d3d08ce7e8 |
| Fit code (the estimation chain) | code hash over the chain files | 7ffc6ae84f8f946e29cfd16dcafd6e55dd746428115680c2bfb2c35695dccde4 |
All 14 code fingerprints written into amendment A7, and all 42 in the input manifest, match the files in the bundle.
Every source
Each source part is one dataset as its publisher released it. Search by country, agency or dataset; the full list adds every file’s name, retrieval date and fingerprint.
Loading the source list…
What was not recorded
- Original addresses for about 19% of source files, mostly older U.S. state school and health files collected before per-file manifests were kept. Their names and fingerprints are listed.
- Whether each source was an open download, an API or an archived page is recorded for some files only.
- The Python package versions used by the fit itself were not logged; the environment file lists the versions installed when this package was built.
- The full command lines of the reporting stages after the fit were not logged; their order and each script’s options are.
Complementary synthesis: data and code
The older analyses on the other tabs have their own provenance files.
Source catalogCSV · dated source records for the earlier synthesisAnalysis catalogCSV · scripts, inputs and outputsReproduction guideMarkdown · acquisition rules and entry pointsReproduction scopeWhat the earlier code and inputs reproduceRelease manifestFile hashes for the PDFs, synthesis and register